
Graphs of Sine, Cosine, and Tangent Functions
Loading the math board and drawing, please wait…
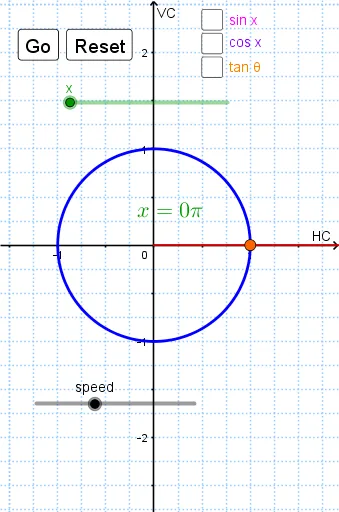
This GeoGebra example dynamically illustrates the graphs of sine, cosine, and tangent functions derived from their unit circle definitions. It covers key trigonometric concepts such as periodicity, symmetry, and the relationship between angles and coordinates. The construction uses GeoGebra commands like Ray, Segment, CurveCartesian, Intersect, Line, and Sequence, creating objects such as the angle θ, origin O, point P on the unit circle, coordinate markers, sliders, and function curves. It is suitable for high‑school and early‑college students studying trigonometric functions and their graphical behavior.
GeoGebra Commands & Parameters
Ray(O, P) → raySegment(P, xMark) → xSegSegment(P, yMark) → ySegCurveCartesian(((0.25 - (0.005 * t)) * cos(t)), ((0.25 - (0.005 * t)) * sin(t)), t, 0, θ) → angIntersect(thetaguide, xAxis) → thetatrackerSegment(Y, sintracker) → singuideSegment(X, costracker) → cosguideLine(P, O) → ray'Intersect(ray', tanline) → TSegment(Z, tantracker) → tanguideSequence(If[θ > (π * i) + π / 2, x = (π * i) + π / 2], i, 0, 31.41593) → asymptotes
AI Drawing Prompt Reference
Create dynamic graphs of the sine, cosine, and tangent functions derived from their unit circle definitions. Show the origin O and the unit-circle point P corresponding to an angle θ, and draw the ray from O through P. From P, include construction lines to the x- and y-axis markers so the corresponding sin and cos guiding segments are visible. Generate curves parameterized by an angle t that trace the unit-circle relationships, and display θ with an updating tracker. Form the tangent line through the construction and mark its intersection point T, then draw the tangent-related guiding segment. Finally, add vertical asymptotes determined by the angle condition so the tangent graph’s periodic behavior and symmetry are evident.
The prompt above was compiled from the original drawing commands and is for reference only.