
Unit Circle and Sine/Cosine Graph
Loading the math board and drawing, please wait…
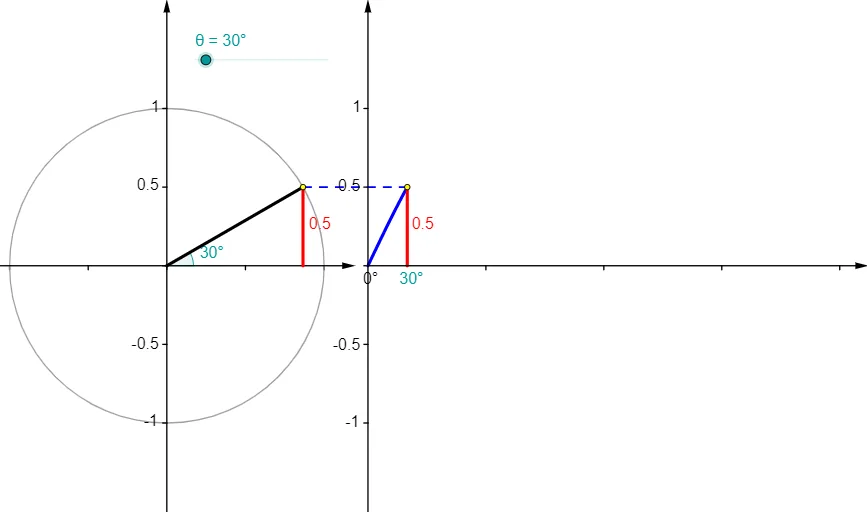
This example demonstrates how to generate the sine graph from the unit circle. It covers core math concepts like the unit circle, trigonometric functions, angles, and vectors. Construction uses commands/objects such as Point, Rotate, Angle, Function, Segment, Circle, Vector, Sequence. Suitable for high school mathematics teaching and learning the generation of sine/cosine graphs.
GeoGebra Commands & Parameters
Point(Ray[(0, 0), (-1, 0)]) → BRotate(A, θ, B) → PRotate(A, θ, B) → A'Angle(A, B, A') → αRotate(A, θ, B) → A'_1Angle(A, B, A'_1) → βFunction(sin((120° * x)), 0, x(Q)) → fSegment(Q, (x(Q), 0)) → eCircle(B, A) → cSegment(B, P) → aVector((x(B), y(Corner[1])), (x(B), y(Corner[4]))) → uVector((0, y(Corner[1])), (0, y(Corner[4]))) → wVector((0, 0), (x(Corner[2]), 0)) → zSequence(Segment[((0.75 * i), 0), ((0.75 * i), -0.025)], i, 1, 4) → list1Segment(P, (x(P), 0)) → bVector(B - (1.2, 0), B + (1.2, 0)) → vSequence(Segment[(0, (0.5 * i) - 1), (-0.025, (0.5 * i) - 1)], i, 0, 4) → list2Sequence(Segment[(x(B), (0.5 * i) - 1), (x(B) - 0.025, (0.5 * i) - 1)], i, 0, 4) → list3Segment(P, Q) → dSequence(Segment[B + ((0.5 * i) - 1, 0), B + ((0.5 * i) - 1, -0.025)], i, 0, 4) → list4Point(Ray[(0, 0), (-1, 0)]) → B_1Rotate(A_1, θ, B_1) → P_1Rotate(A_1, θ, B_1) → A'_2Rotate(A_1, θ, B_1) → A'_3Circle(B_1, A_1) → c_1Segment(B_1, P_1) → a_1
AI Drawing Prompt Reference
Draw a unit circle and sine curve graph. The unit circle is centered at the origin with radius 1. The sine curve starts from the origin and rises as the angle increases. The graph includes the unit circle, the sine curve, and auxiliary lines such as rays from the origin and rotated points. The construction order is to first draw the unit circle, then generate the sine curve by rotating points, and finally add auxiliary lines to show relationships.
The prompt above was compiled from the original drawing commands and is for reference only.