
Uniform Acceleration Motion Graphs
Loading the math board and drawing, please wait…
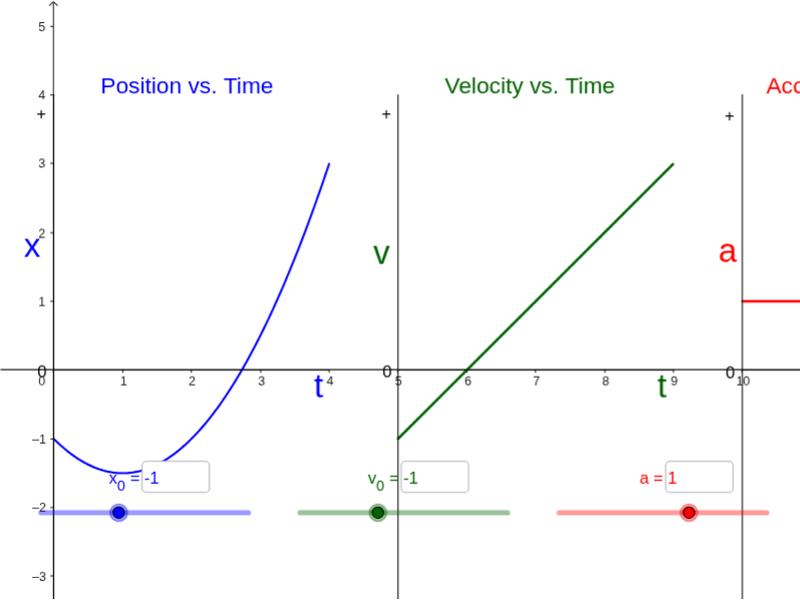
This example demonstrates the relationships between displacement-time and velocity-time graphs in uniformly accelerated motion. Key math concepts include uniform acceleration formulas, function graphs, and intersection points. Constructed using GeoGebra commands like Segment, Midpoint, and Textfield. Ideal for high school physics students learning kinematics and graph analysis.
GeoGebra Commands & Parameters
Segment(A, B) → a_3Midpoint(a_3) → DSegment(D, C) → bSegment(A_1, B_1) → a_1Midpoint(a_1) → D_1Segment(D_1, C_1) → b_1Segment(A_2, B_2) → a_2Midpoint(a_2) → D_2Segment(D_2, C_2) → b_2Textfield(x_0) → inputBox1Textfield(v_0) → inputBox2Textfield(a) → inputBox3
AI Drawing Prompt Reference
Draw a graph to demonstrate the displacement-time and velocity-time relationships in uniformly accelerated motion, including two lines representing the displacement and velocity versus time. Key points should be marked and connected to form line segments, showing the intersection points between the graphs. Add input boxes to allow dynamic adjustment of the graph by entering initial displacement, initial velocity, and acceleration values.
The prompt above was compiled from the original drawing commands and is for reference only.