
Understanding Perimeter
Loading the math board and drawing, please wait…
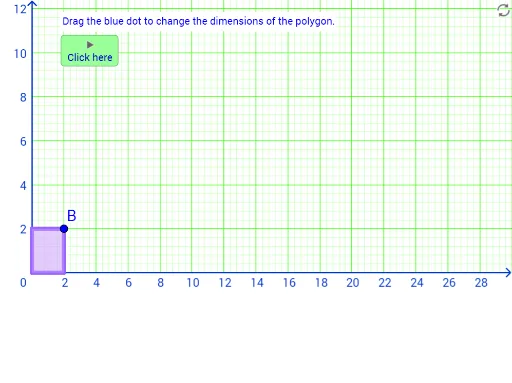
This example demonstrates the calculation and visualization of the perimeter of polygons. It involves core mathematical concepts such as perimeter, inequalities, division, arithmetic mean, and integers. The construction utilizes GeoGebra commands like Sort, Polygon, Sequence, Rotate, Flatten, Max, along with objects like g, f, panneeded, panner, B, permtimer, A, D, C, xvalues, xmin, yvalues, ymin, poly1, a, d, b, c, list8, list5, list7, list12, list6, list13, F, list14, list11, E, Area, perm, button1, button2, opacity, arealist, list1, areatimer, e, areanumbers, list9, permlist. It is suitable for middle school students and above, as well as educators for teaching demonstrations.
GeoGebra Commands & Parameters
Sort({x(A), x(B), x(C), x(D)}) → xvaluesSort({y(A), y(B), y(C), y(D)}) → yvaluesPolygon(A, D, B, C) → poly1, a, d, b, cSequence(Point[{xmin + c - i, ymin}], i, 1, c) → list8Sequence(Point[{xmin, ymin + i}], i, 0, a) → list5Sequence(Rotate[Point[{xmin + c, ymin + a - i}], (permtimer * ((-π)) / 2), (xmin + c, ymin)], i, 1, a) → list7Rotate(list5, (permtimer * ((-π)) / 2), list7(a)) → list12Sequence(Rotate[Point[{xmin + i, ymin + a}], (permtimer * ((-π)) / 2), list7(a)], i, 1, c) → list6Rotate(list12, (permtimer * ((-π)) / 2), list6(c)) → list13Rotate(list13, (permtimer * ((-π)) / 2), F) → list14Rotate(list6, (permtimer * ((-π)) / 2), list6(c)) → list11Sequence(Point[{Min[xvalues] + i, Min[yvalues] - 4}], i, 0, Area - 1) → arealistFlatten(Sequence[Sequence[Point[{Min[xvalues] + i, Min[yvalues] + j}], i, 0, c - 1], j, 0, a - 1]) → list1Sequence(Text[i, arealist(i) + (0.1, 0.2)], i, 1, Area) → areanumbersFlatten({Reverse[list8], Reverse[list7], Reverse[list11], Reverse[list14]}) → list9Sequence(Point[{Min[xvalues] + i, Min[yvalues] - 2}], i, 0, perm) → permlistSequence((permlist(i) * permmover) + (list9(i) * (1 - permmover)), i, 1, Length[list9]) → list10Sequence(Segment[list10(i), list10(i + 1)], i, 1, perm) → list15Max(a + 1, ((R - L) * 17.4 / 32) + BOT) → T
AI Drawing Prompt Reference
Create a visualization of a polygon's perimeter, demonstrating perimeter calculation and inequality relationships. Start by constructing a polygon, then generate a series of points based on the polygon's vertex coordinates. Use rotation and sequence operations to create dynamic effects. Display the perimeter value and area, connect relevant points with lines, and finally annotate the perimeter and area values with text, combining mathematical concepts with dynamic graphics.
The prompt above was compiled from the original drawing commands and is for reference only.