
Two Way Tables
Loading the math board and drawing, please wait…
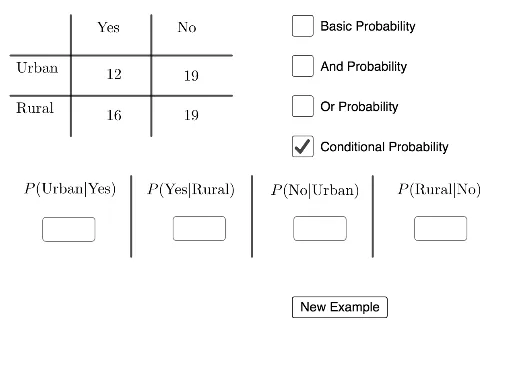
This example demonstrates how to create two-way tables in GeoGebra for statistical data analysis and probability reasoning. Core math concepts include probability & statistics, logic, and data visualization. Construction highlights involve using commands like Random for data generation, Segment for table structure, and Textfield for labeling, with objects such as v11, v12, v21, v22, and total. Suitable for high school mathematics education, particularly for introductory probability and data analysis projects.
GeoGebra Commands & Parameters
Random(5, 20) → v11Random(5, 20) → v12Random(5, 20) → v21Random(5, 20) → v22Segment(A, B) → fSegment(C, D) → gSegment(E, F) → hSegment(G, H) → iTextfield(ans1) → InputBox1Textfield(ans2) → InputBox2Textfield(ans3) → InputBox3Textfield(ans4) → InputBox4Segment(I, J) → jSegment(K, L) → kSegment(M, N) → l
AI Drawing Prompt Reference
Create a two-way table with four randomly generated numbers v11, v12, v21, and v22 in four cells. Use segments to connect the rows and columns to form the table structure. Add four text fields below the table for inputting the values of v11, v12, v21, and v22.
The prompt above was compiled from the original drawing commands and is for reference only.