
Turning Points and Intercepts of a Parabola Function
Loading the math board and drawing, please wait…
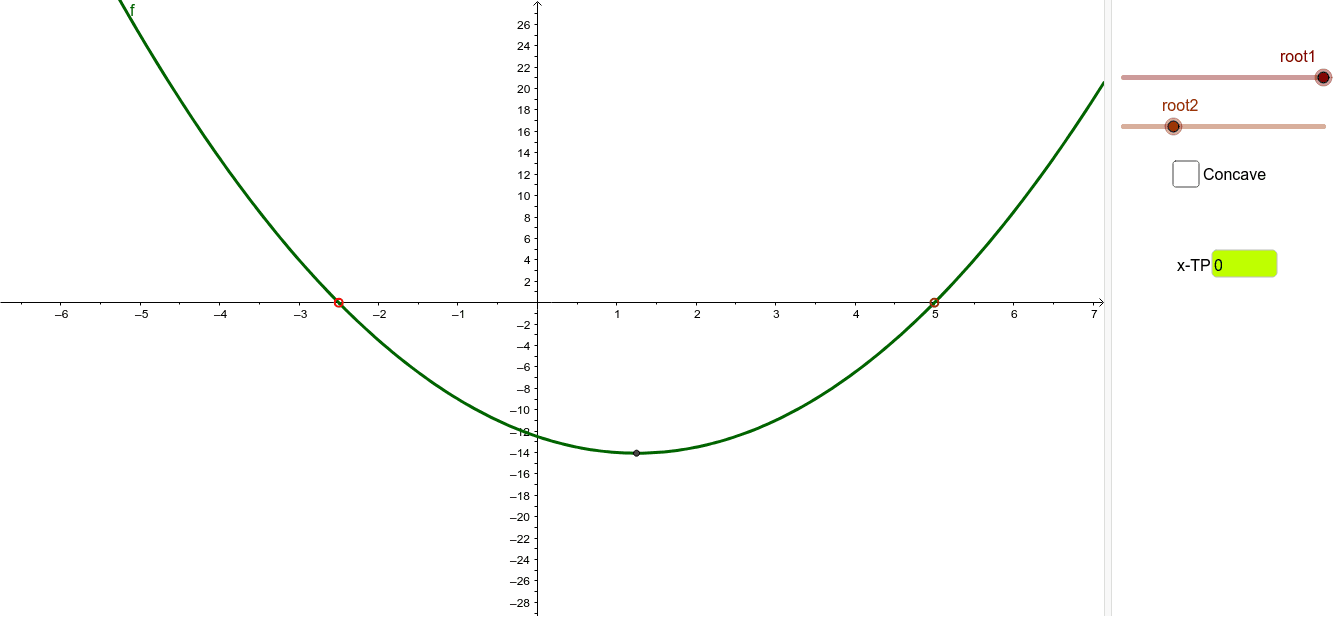
This GeoGebra example dynamically demonstrates how to find the turning point (vertex) and intercepts of a parabola function, visually highlighting key features of quadratic graphs. Core mathematical concepts include the vertex formula, discriminant and roots, intersection points with axes, and the geometric meaning of extrema. Construction details: commands such as If, Extremum, and Intersect are used to compute critical points and intersections; Textfield and InputBox1 enable interactive user input for answers; LaTeX displays mathematical expressions; Segment connects relevant points for clarity. Suitable for middle and high school students learning quadratic functions, graph analysis, and the connection between algebra and geometry, as well as for classroom demonstrations or self-paced exploration.
GeoGebra Commands & Parameters
If(b, -1, 1) → aExtremum(f) → CIntersect(f, y = 0) → A, A_2Textfield(userans) → InputBox1If(userans ≟ x(C), "Correct", "Wrong") → ansLaTeX(f, true, true) → text1Segment(A, (x(C), 0)) → hSegment(D, A_2) → i
AI Drawing Prompt Reference
Draw a parabola function graph, marking its vertex and two x-axis intercepts. Place a point at the vertex and draw a dashed vertical segment from the vertex down to the x-axis. Connect the two intercepts with a line segment. Display the function's LaTeX expression near the graph, and include an input box where users can enter the x-coordinate of the vertex, with feedback showing 'Correct' or 'Wrong' based on the input. The layout should be clean and educational, highlighting the turning point and intercepts of the quadratic.
The prompt above was compiled from the original drawing commands and is for reference only.