
Trip Planning Task
Loading the math board and drawing, please wait…
This example demonstrates how to use GeoGebra to plot and calculate graphics and phenomena involving Poisson Distribution, Sine, Ellipse, Upper and Lower Sum or Riemann Sum, and Parametric Curves. Key math concepts include Poisson Distribution, Trigonometry, Ellipse Equations, Riemann Sums, and Parametric Equations. Construction highlights from the summary include commands like Polygon and RotateText. Suitable for high school and above learners to understand parametric equations, integral concepts, and function graphing.
GeoGebra Commands & Parameters
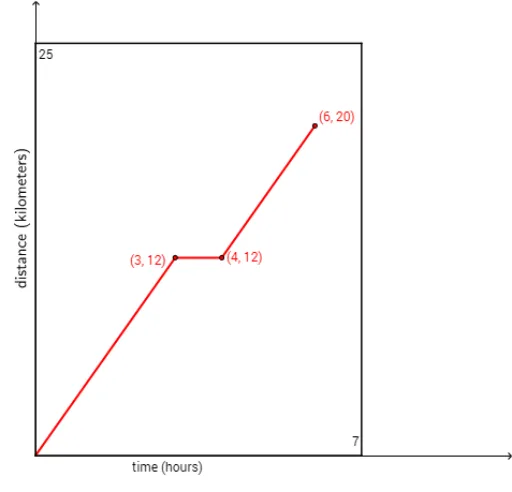
Polygon((0, 0), (7, 0), (7, 25), (0, 25)) → poly1, f, g, h, iRotateText("distance (kilometers)", 90°) → text3
AI Drawing Prompt Reference
Draw a rectangle with vertices at (0,0), (7,0), (7,25), and (0,25). Then rotate the text 'distance (kilometers)' by 90 degrees so that it is perpendicular to the bottom side of the rectangle.
The prompt above was compiled from the original drawing commands and is for reference only.