
Trigonometric Function Transformations - Degrees
Loading the math board and drawing, please wait…
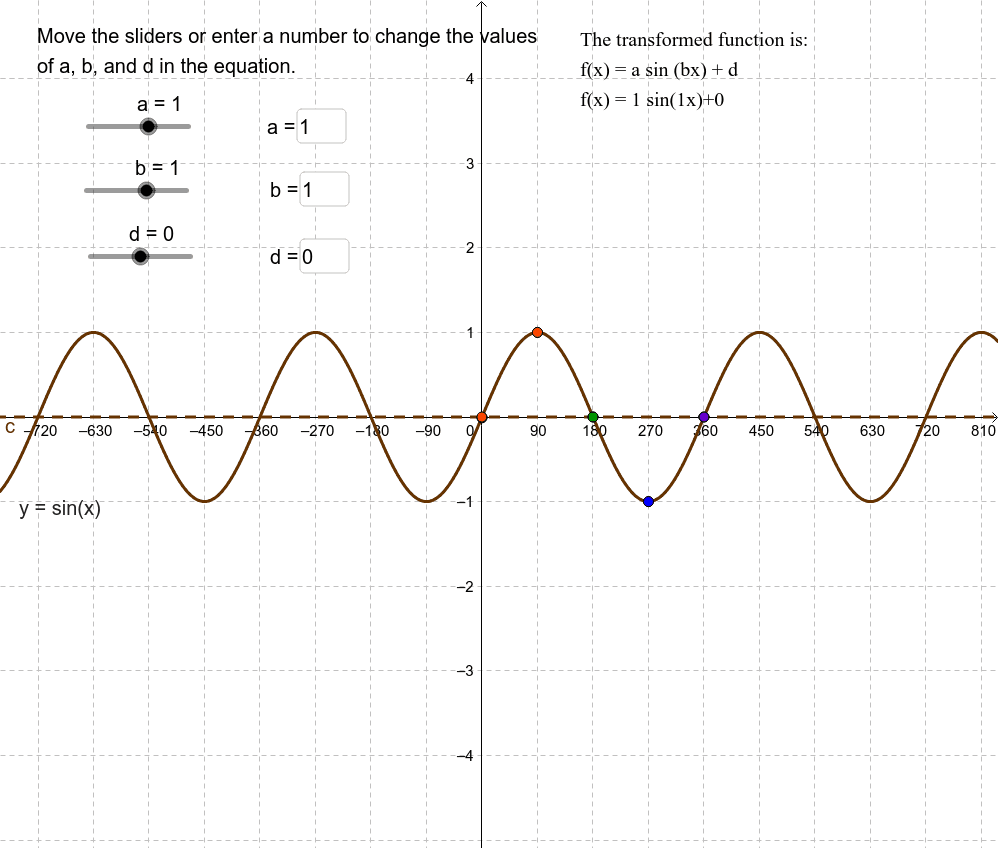
This example demonstrates transformations of trigonometric functions (sine, cosine) including amplitude, period, and vertical shift, with angles measured in degrees. It covers core concepts like trigonometric graphs, amplitude, period, vertical shift, and degree measurement. Constructed using GeoGebra commands and objects such as Textfield, sliders (a, b, d, g, f), points (A, B, C, D, E, B', C', A', D', E'), and input boxes (text1, text2, inputBox1, inputBox2, inputBox3) for interactive exploration. Ideal for high school mathematics education to visually illustrate the rules of trigonometric function transformations.
GeoGebra Commands & Parameters
Textfield(a) → inputBox1Textfield(b) → inputBox2Textfield(d) → inputBox3
AI Drawing Prompt Reference
Create a graph demonstrating transformations of trigonometric functions like sine and cosine, showing amplitude, period, and vertical shift. Use sliders to control these parameters and label key points to illustrate how the function graph changes with different settings.
The prompt above was compiled from the original drawing commands and is for reference only.