
Trapezoid Area Inequality Demo
Loading the math board and drawing, please wait…
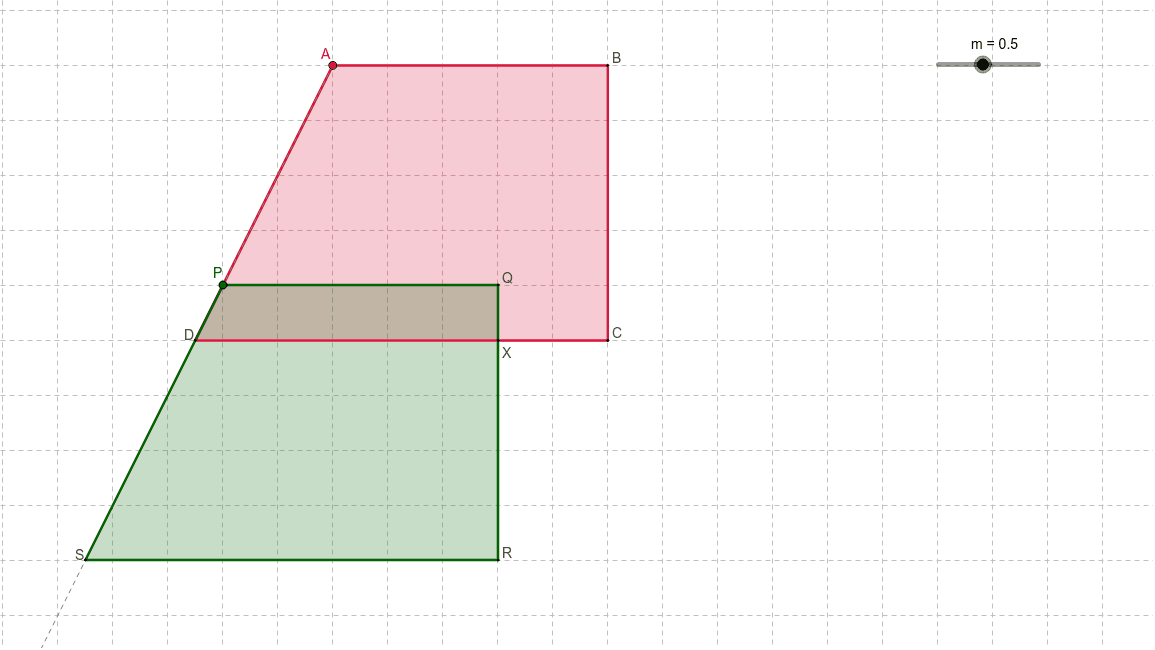
① This example shows how to construct a trapezoid in GeoGebra and dynamically illustrate the relationship between its area and an associated inequality. ② Core mathematical concepts include polygon area computation, inequality derivation, polynomial function graphs, and geometric constructions such as the orthocenter. ③ Construction highlights: Polygon creates the two trapezoids (poly1, poly2); Ray and Point define vertices; Intersect finds intersection points; the command objects m, A, B, C, D, a_1, b, c, d, e, P, Q, R, S, p, q, r, s, X drive the construction. ④ Suitable for high‑school geometry and algebra integration lessons, as well as university‑level geometric modeling demonstrations.
GeoGebra Commands & Parameters
Polygon(A, B, C, D) → poly1, a_1, b, c, dRay(A, D) → ePoint(e) → PPolygon(P, Q, R, S) → poly2, p, q, r, sIntersect(c, q) → X
AI Drawing Prompt Reference
Draw a trapezoid area inequality demonstration diagram. Include two trapezoids poly1 and poly2, vertices defined by a ray and a point, and an intersection point X. Ensure the diagram clearly shows the relationship between the trapezoid areas and the inequality.
The prompt above was compiled from the original drawing commands and is for reference only.