
Trapezium Rule Demonstration by pirsquared (2)
Loading the math board and drawing, please wait…
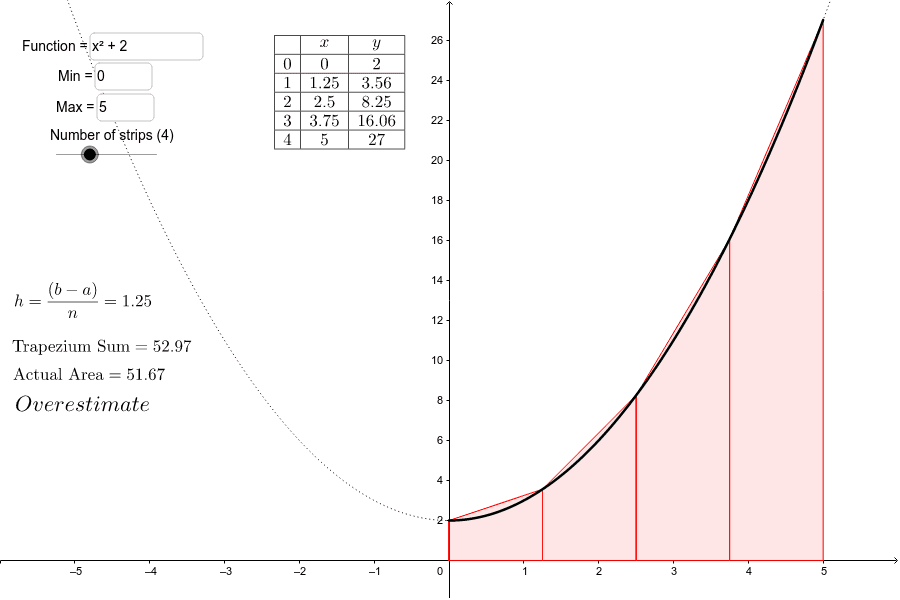
This example demonstrates the Trapezium Rule, a numerical integration method. By adjusting the function and interval, one can intuitively understand how the Trapezium Rule works. Core mathematical concepts include functions, integrals, and numerical methods. GeoGebra commands used include Integral, Textfield, Sequence, TrapezoidalSum, Function, TableText, and If. Suitable for high school mathematics education and learning.
GeoGebra Commands & Parameters
Integral(f, a, b) → ITextfield(f) → inputBox1Textfield(a) → inputBox2Textfield(b) → inputBox3Sequence(a + (b - a) * i / n, i, 0, n) → L_1TrapezoidalSum(f, a, b, n) → cFunction(f, a, b) → fShowTableText({Append["", Sequence[i, i, 0, n]], Append[x, L_1], Append[y, L_y]}, "vc|_") → text4If(I < c, LaTeX["Overestimate"], LaTeX["Underestimate"]) → text4_1
AI Drawing Prompt Reference
Draw a trapezoidal rule demonstration graph with an adjustable function f(x), interval [a, b], and n equally spaced points. First, plot the function f(x) over the interval [a, b], then draw the trapezoids formed by the n equally spaced points, showing the integral value I and the trapezoidal sum c. Finally, display 'Overestimate' or 'Underestimate' based on the comparison between I and c.
The prompt above was compiled from the original drawing commands and is for reference only.