
Translation in the Direction of the Y-Axis
Loading the math board and drawing, please wait…
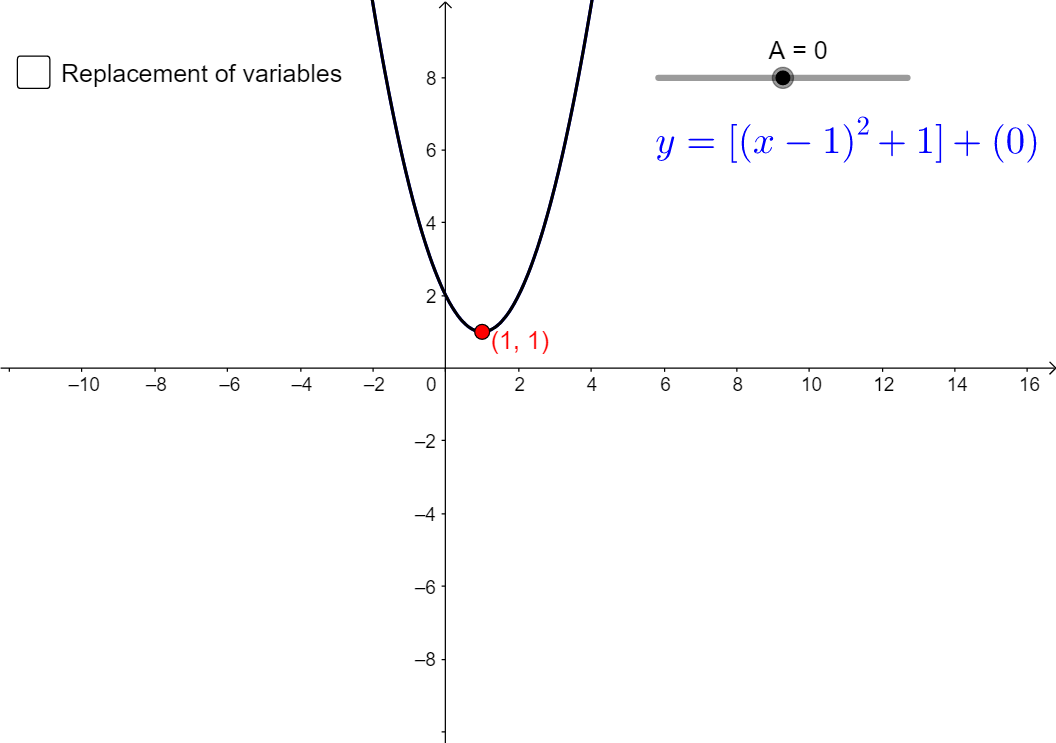
This GeoGebra example demonstrates how a function graph translates vertically along the y-axis as the parameter A changes. The core mathematical concept is the vertical translation of a function graph, represented by y = f(x) + A, where the value of A shifts the entire graph up or down. The construction uses the Intersect command to create intersection points, and involves objects such as A (a slider parameter), f (the original function), g (the translated function), text objects text1, text2, text3, and auxiliary objects a, h, and O. By dragging the slider A, learners can observe the dynamic vertical movement of the graph. This resource is suitable for middle or high school mathematics lessons on function transformations, graph shifts, and the effect of parameters on function graphs, and can be used for classroom demonstrations or self-directed exploration.
GeoGebra Commands & Parameters
Intersect(f, h) → O
AI Drawing Prompt Reference
Draw a function graph and show its vertical translation along the y-axis. Use a slider to control the translation amount, and mark the intersection points between the original and translated function graphs. Add text labels for the original function, the translated function, and the translation amount, with auxiliary lines to illustrate the translation process. Observe the vertical movement of the function graph by dragging the slider.
The prompt above was compiled from the original drawing commands and is for reference only.