
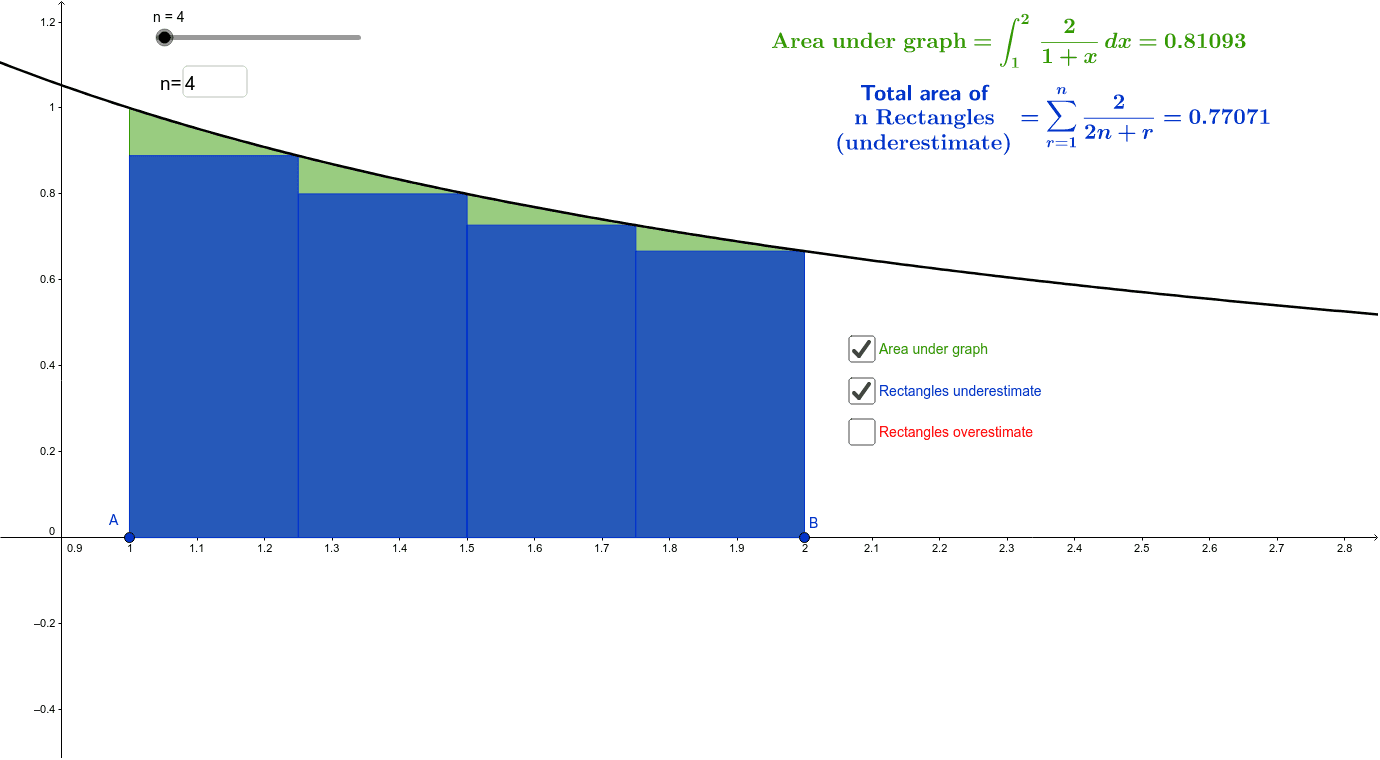
Area under graph and Total Area of n Rectangles
Loading the math board and drawing, please wait…
This example demonstrates approximating the area under a function's graph using n rectangles, comparing it with the actual integral value. Core math concepts include definite integrals, Riemann sums (upper and lower), limit concepts, derivatives, and continuity. It uses GeoGebra commands/objects like Point, UpperSum, Integral, LowerSum, Textfield for visualization and explanation, suitable for high school and above learning calculus, numerical integration, and limits.
GeoGebra Commands & Parameters
Point(xAxis) → APoint(xAxis) → BUpperSum(f, x(A), x(B), n) → bIntegral(f, 1, 2) → cLowerSum(f, x(A), x(B), n) → aTextfield(n) → InputBox1