
Transforming the Sine Curve
Loading the math board and drawing, please wait…
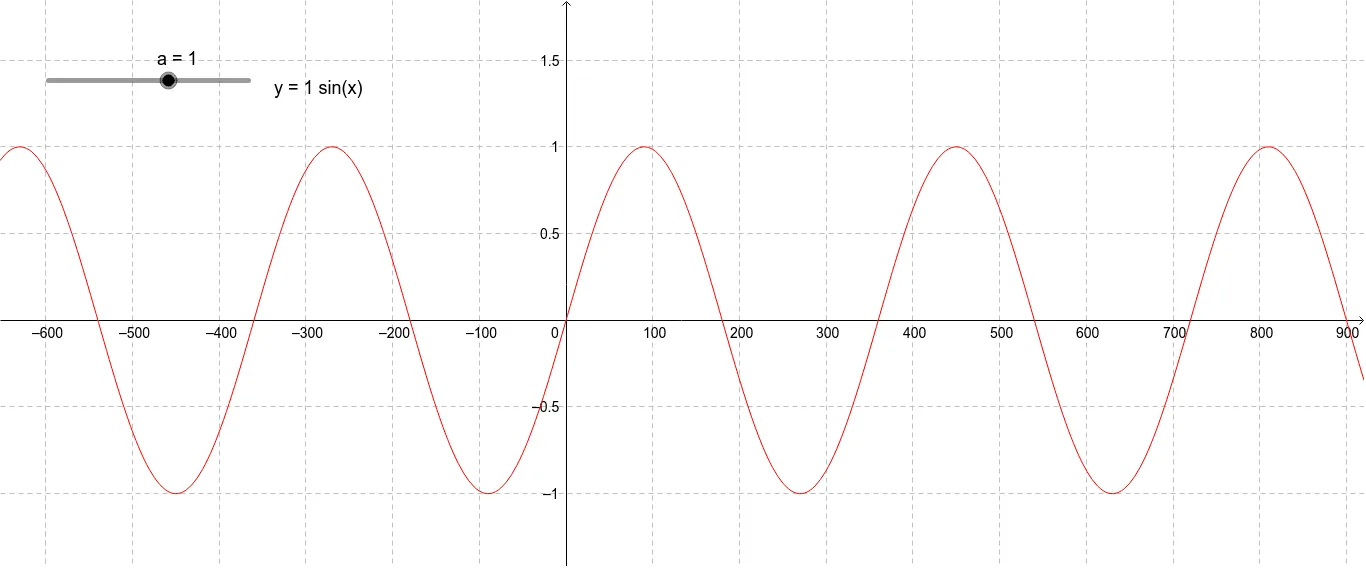
This example demonstrates how changing parameters affects the sine curve's shape and position. It involves core math concepts like sine functions, function transformations (translation, scaling), and the impact of parameters. Constructed using GeoGebra objects: a (parameter), f (function), text1 (text label). Suitable for high school mathematics teaching to understand function transformations and parameter effects.
GeoGebra Commands & Parameters
Numeric a(1.0)f(x) = (a * sin(x°))
AI Drawing Prompt Reference
Draw a sine function graph and show how the parameter a affects its shape and position. Start by plotting the basic sine curve, then observe the stretching and compressing of the curve by adjusting the value of parameter a. Label the value of parameter a in the graph and use text to explain the impact of the parameter on the sine function, demonstrating the effects of translation and scaling in function transformations.
The prompt above was compiled from the original drawing commands and is for reference only.