
Transforming the Sine Curve 4
Loading the math board and drawing, please wait…
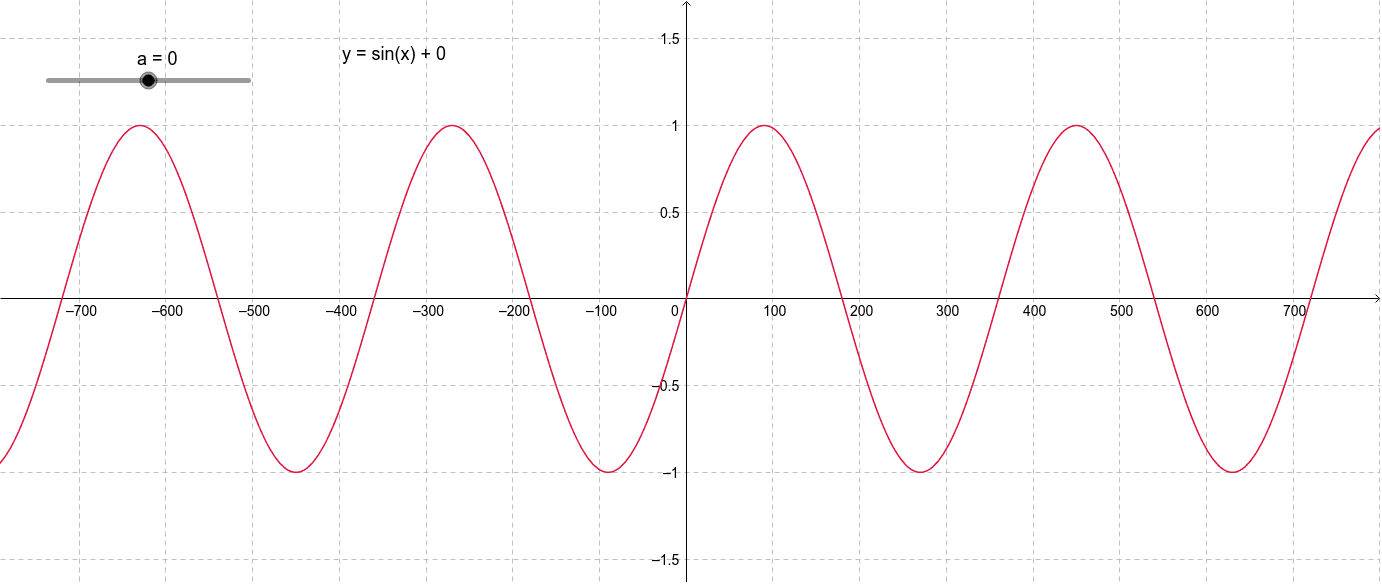
This example demonstrates how to transform the sine curve by adjusting parameters, showing the dynamic changes of the function graph as parameters vary. The core mathematical concepts include amplitude, period, phase shift, and vertical shift of sine functions, as well as general rules of function transformations. Construction highlights: using GeoGebra objects such as a (likely a slider or parameter), f (the sine function graph), and text1 (a text label), users can drag the slider to observe real-time changes in the curve and see the corresponding function expression or parameter values. It is suitable for high school students learning trigonometric function transformations, and also for teachers to demonstrate in class, helping students understand the impact of parameters on function graphs and build an intuitive connection between algebra and geometry.
GeoGebra Commands & Parameters
Numeric a(0.0)f(x) = sin(x°) + a
AI Drawing Prompt Reference
Draw a sine curve and adjust its height by dragging parameter a. Initially set a to 0, so the curve is y=sin(x). As a changes, the curve will move up or down accordingly, showing the amplitude change of the sine function.
The prompt above was compiled from the original drawing commands and is for reference only.