
Transforming the Sine Curve 3: Parameter-Driven Dynamic Visualization
Loading the math board and drawing, please wait…
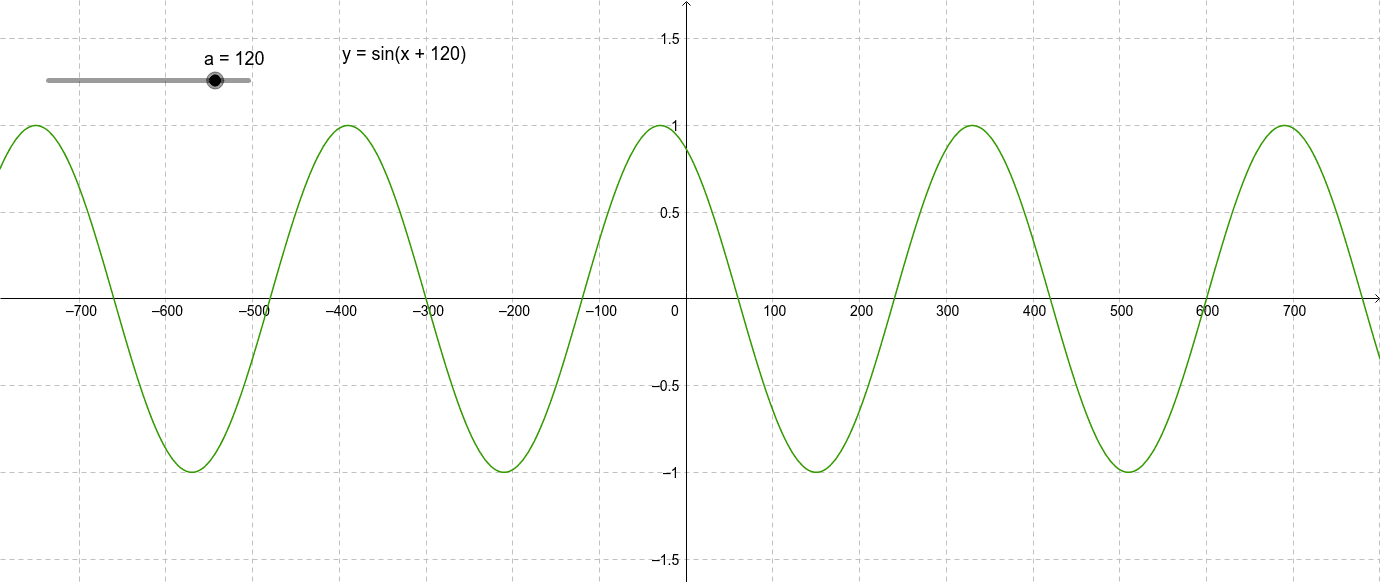
①This example demonstrates how to apply translations, stretches, and compressions to the sine curve using adjustable parameters, with real-time visual feedback. ②Core mathematical concepts include amplitude, period, phase shift, and vertical shift of sine functions, along with general function transformation rules. ③Construction highlights: based on the summary, it uses GeoGebra objects such as a (likely a slider parameter), f (the sine function graph), and text1 (a text label), where the slider controls transformation parameters and updates the function expression and graph dynamically. ④Suitable for high school or pre-university students learning trigonometric transformations, and for teachers to illustrate parameter effects in classroom demonstrations.
GeoGebra Commands & Parameters
Numeric a(120.0)f(x) = sin((x + a)°)
AI Drawing Prompt Reference
Draw a sine curve and adjust its translation, stretch, and compression using a slider. The slider controls phase shift, period, amplitude, and vertical shift, updating the curve in real-time. Initially, the slider value is 120°, and the sine curve's equation is sin((x + 120)°).
The prompt above was compiled from the original drawing commands and is for reference only.