
Transforming Quadratics by tjduarte
Loading the math board and drawing, please wait…
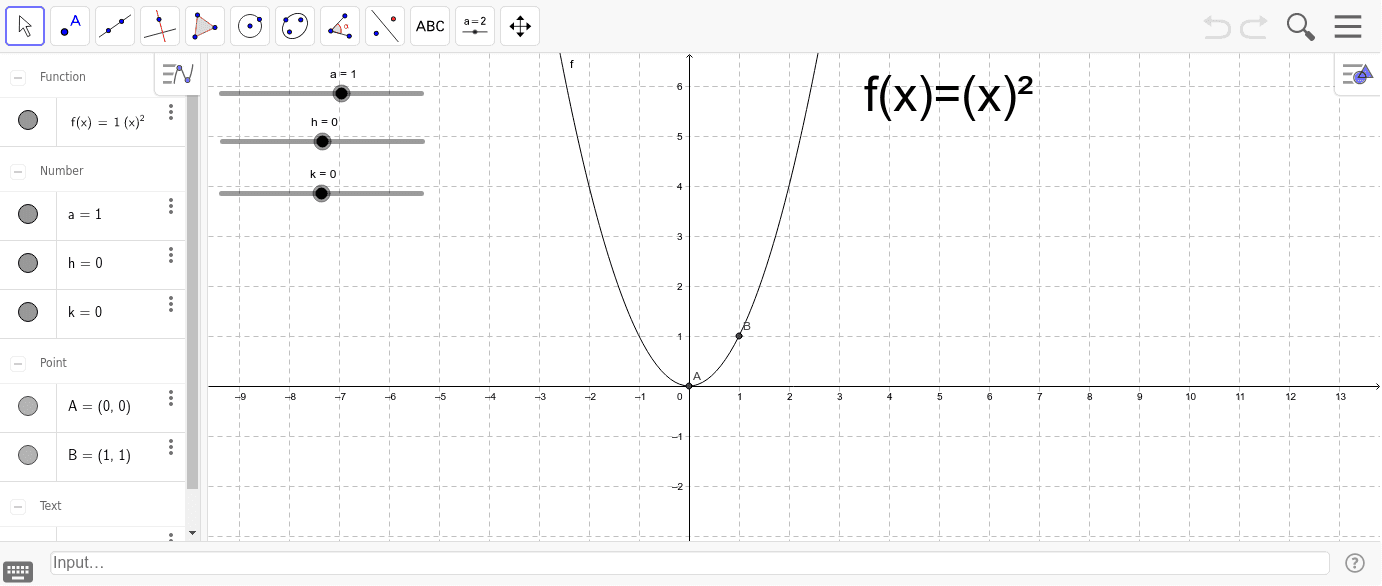
This example demonstrates the effects of parameters a, h, and k on the graph of a quadratic function y=a(x-h)^2+k. It covers core math concepts like quadratic functions, vertex, axis of symmetry, and the influence of parameters on graph shape and position. Constructed using GeoGebra objects: sliders a, h, k, function f, text object text1, points A, B. Suitable for high school students learning quadratic function properties and parameter significance, or for educational purposes.
GeoGebra Commands & Parameters
Numeric a(1.0)Numeric h(0.0)Numeric k(0.0)f(x) = (a * (x - h)^(2)) + k(h, k)(h + 1, f(h + 1))
AI Drawing Prompt Reference
Draw the graph of a quadratic function y=a(x-h)^2+k, showing the effects of parameters a, h, k. Include the function graph, vertex, and axis of symmetry, with sliders to adjust the parameters. Initially set a, h, k to 1, 0, 0, placing the vertex at the origin. Also mark the vertex and another point on the x-axis to observe how parameter changes affect the graph's shape and position.
The prompt above was compiled from the original drawing commands and is for reference only.