
Transforming Graph C3 2
Loading the math board and drawing, please wait…
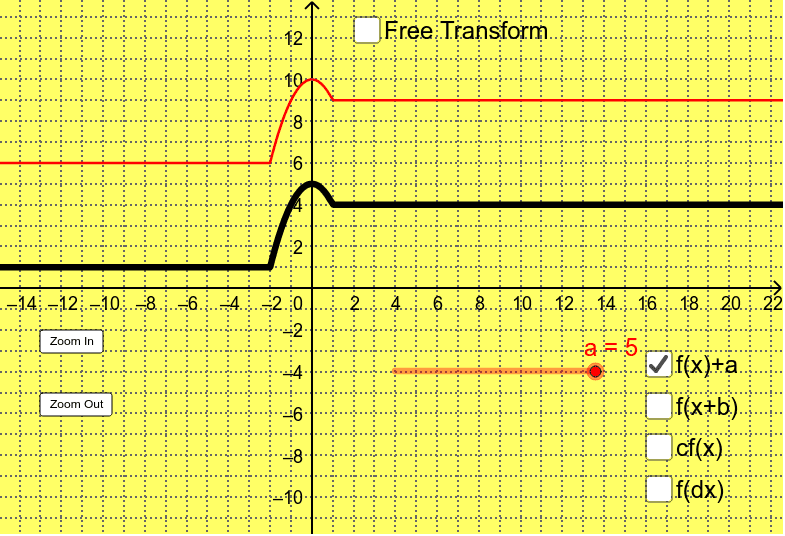
This example demonstrates how changing parameters like a, b, c affects the graph of function f(x), focusing on transformations, trigonometric properties, continuity, and optimization problems. It uses GeoGebra commands and objects such as Textfield, f, a, g, b, h, c, p, d, q, r, inputBox1, e, i, j, k, l, button1, button2 for interactive exploration, making it suitable for high school and above mathematics learners to understand function transformations and parameter impacts.
GeoGebra Commands & Parameters
Textfield(r) → inputBox1
AI Drawing Prompt Reference
Draw a function graph and show how changing parameters affects the graph. Include an input box for entering parameters, along with related text and graphical objects for interactive exploration of function transformations and parameter impacts.
The prompt above was compiled from the original drawing commands and is for reference only.