
Transforming Exponential Functions by Changing the BASE
Loading the math board and drawing, please wait…
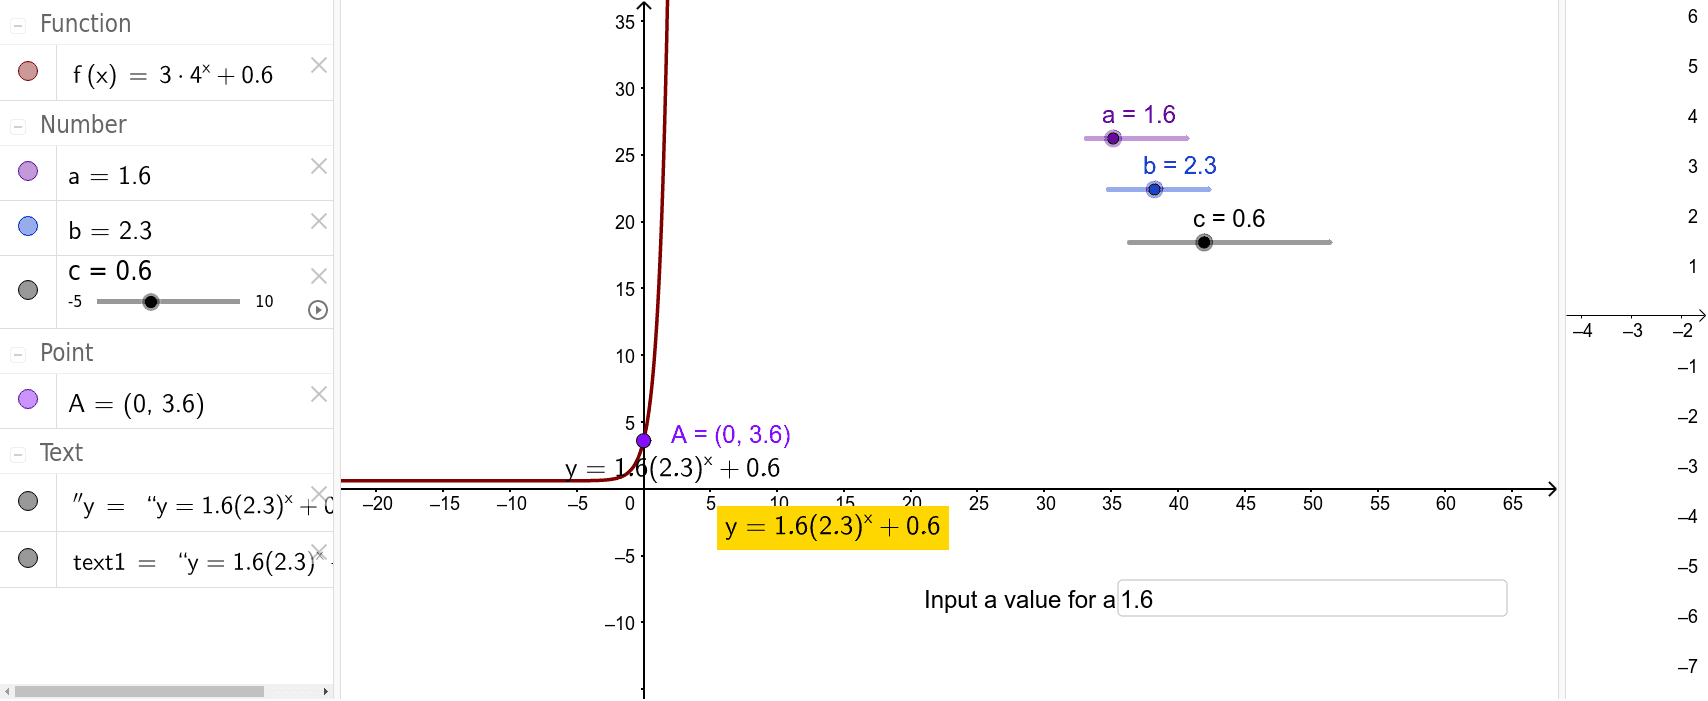
This example demonstrates how the graph of an exponential function changes when the base is modified. Key math concepts include the properties of exponential functions, the effect of the base on the function's graph, and transformations such as translations and dilations. GeoGebra commands used include Intersect, Textfield, and InputBox1 to construct the function expression and receive user inputs. Suitable for high school students learning about exponential functions and transformations.
GeoGebra Commands & Parameters
Intersect(f, yAxis, (0, 3.6)) → ATextfield(a) → InputBox1
AI Drawing Prompt Reference
Draw the graph of an exponential function and show how the graph changes when the base is modified. Mark a point on the x-axis and display its intersection with the y-axis to illustrate the function's properties. Include an input box for users to change the base value and observe the real-time graph transformation.
The prompt above was compiled from the original drawing commands and is for reference only.