
Transformations of Trig Functions
Loading the math board and drawing, please wait…
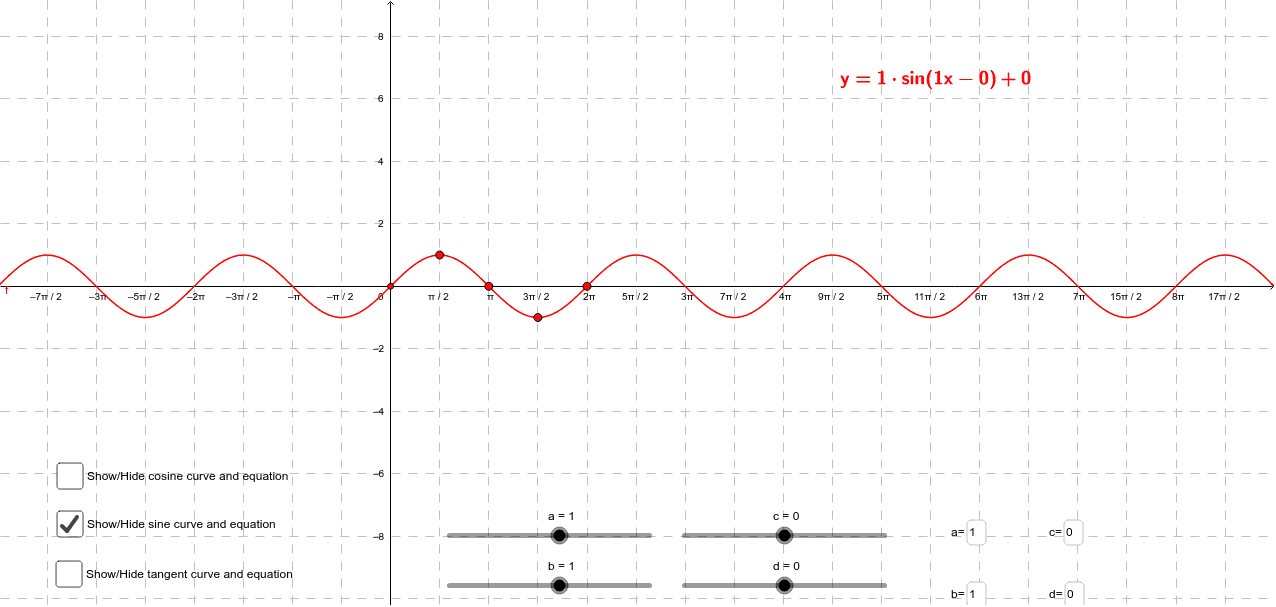
This example demonstrates how changing parameters a, b, c, d affects the graph of y = a cos(bx-c) + d. It covers core math concepts like trigonometric functions, function transformations (scaling, translation), and parameter influence. Construction uses GeoGebra commands/objects such as Textfield, a, b, c, d, f, g, h, text1, text2, k, e, text3, i, inputBox1, inputBox2, inputBox3, inputBox4, P, Q, R, S, O. Suitable for high school mathematics teaching to understand trigonometric function graph transformation rules.
GeoGebra Commands & Parameters
Textfield(a) → inputBox1Textfield(b) → inputBox2Textfield(c) → inputBox3Textfield(d) → inputBox4
AI Drawing Prompt Reference
Create a graph demonstrating transformations of trigonometric functions, showing how parameters a, b, c, and d affect the graph of y = a cos(bx-c) + d. Include four input boxes for the parameters and plot the function graph to observe the effects of parameter changes on scaling and translation of the graph.
The prompt above was compiled from the original drawing commands and is for reference only.