
Transformations of Quadratic Functions by ILC Curriculum
Loading the math board and drawing, please wait…
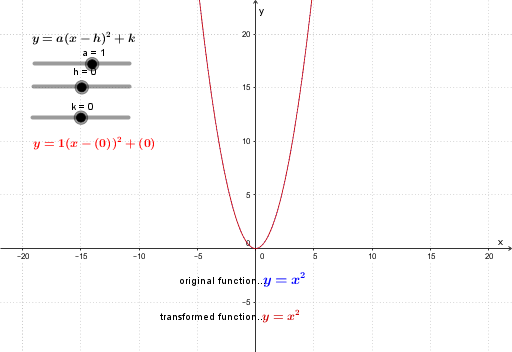
This example demonstrates the effects of transformations on quadratic function graphs, including translations and scalings. Key math concepts involve quadratic functions, transformations, parameters a, h, k, vertex coordinates, and changes in graph shape. Construction highlights include using GeoGebra objects h, k, a, e, quadratic, A, B, and text elements text4, text5, text7, text6, text1, text2 for parameter control and visualization. Suitable for high school mathematics education to understand the impact of function transformations on graphs.
GeoGebra Commands & Parameters
Numeric h(0.0)Numeric k(0.0)Numeric a(1.0)Conic ey = (a * (x - h)^(2)) + kPoint A(-12.653061224489795, 3.162162162162162)Point B(-12.653061224489798, 16.759459459459464)
AI Drawing Prompt Reference
Draw a graph showing transformations of quadratic functions including translations and scalings, with key parameters a, h, k, vertex coordinates, and changes in graph shape. Use different colored lines for original and transformed functions, and label parameter values and vertex positions.
The prompt above was compiled from the original drawing commands and is for reference only.