
Transformation of Quadratic Functions by GreenMaths
Loading the math board and drawing, please wait…
In collections
Transforming Functions
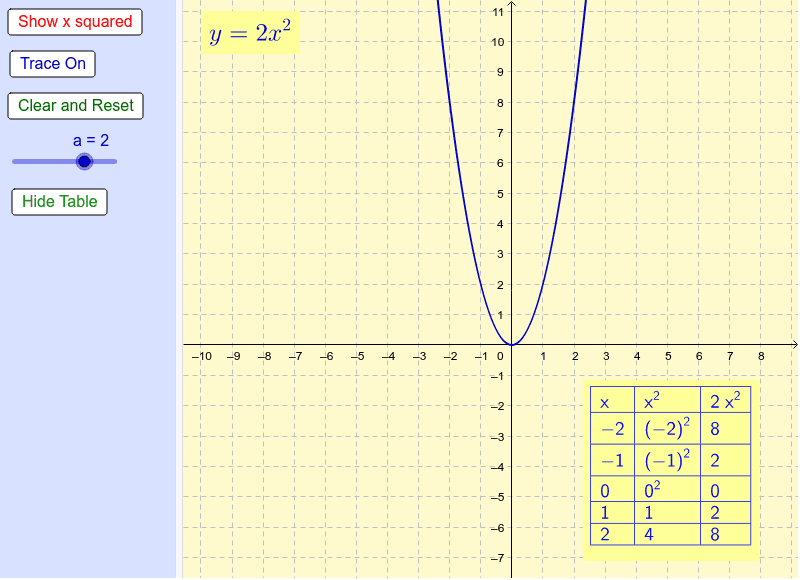
This example demonstrates the effect of changing the coefficient of a quadratic function on its graph. By comparing the graph and table of values, understand the basic properties of quadratic functions. Utilizes GeoGebra commands such as TableText and objects, suitable for secondary school mathematics education.
GeoGebra Commands & Parameters
TableText({{A1, B1, C1}, {A2, B2, C2}, {A3, B3, C3}, {A4, B4, C4}, {A5, B5, C5}, {A6, B6, C6}}, "|_") → text2
AI Drawing Prompt Reference
Draw the graph of a quadratic function to show the effect of changing its coefficients. Include a table displaying function values for different coefficients, and compare the graph and table to understand the basic properties of quadratic functions.
The prompt above was compiled from the original drawing commands and is for reference only.