
Transformation of Quadratic Functions by GreenMaths (2)
Loading the math board and drawing, please wait…
In collections
Transforming Functions
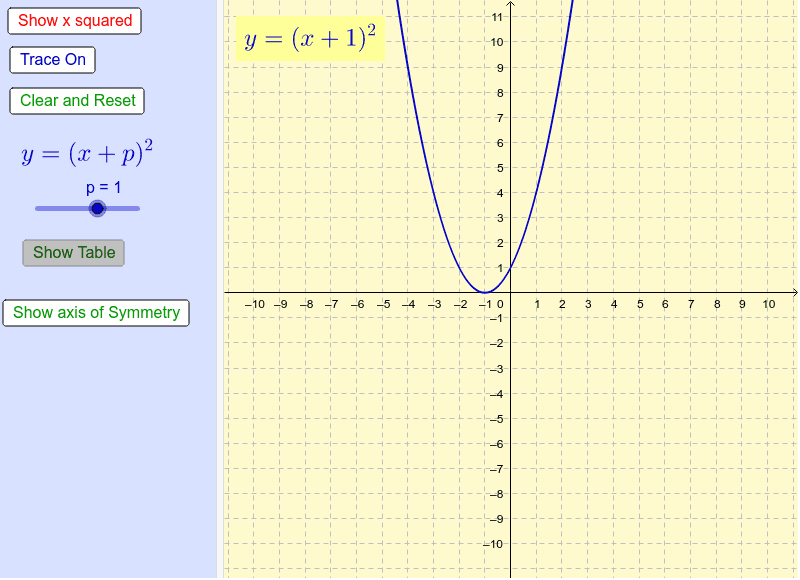
This example demonstrates the effect of changing the value of p when the x squared term in a quadratic is replaced by (x + p) squared. By comparing the graph and the table, you can intuitively understand the transformation rules of quadratic functions. It uses GeoGebra commands like TableText and is suitable for high school mathematics education and learning.
GeoGebra Commands & Parameters
TableText({{A1, B1, C1}, {A2, B2, C2}, {A3, B3, C3}, {A4, B4, C4}, {A5, B5, C5}, {A6, B6, C6}, {A7, B7, C7}, {A8, B8, C8}}, "c_|") → text3
AI Drawing Prompt Reference
Draw a graph demonstrating the transformation of quadratic functions when the x-squared term is replaced by (x+p)squared, showing the effect of changing p on the function's graph. Include function graphs and a table to intuitively understand the transformation rules. The table displays function values for different p values, and the graph shows changes in the opening direction and vertex position of the function.
The prompt above was compiled from the original drawing commands and is for reference only.