
Transformation of Parabola Graph
Loading the math board and drawing, please wait…
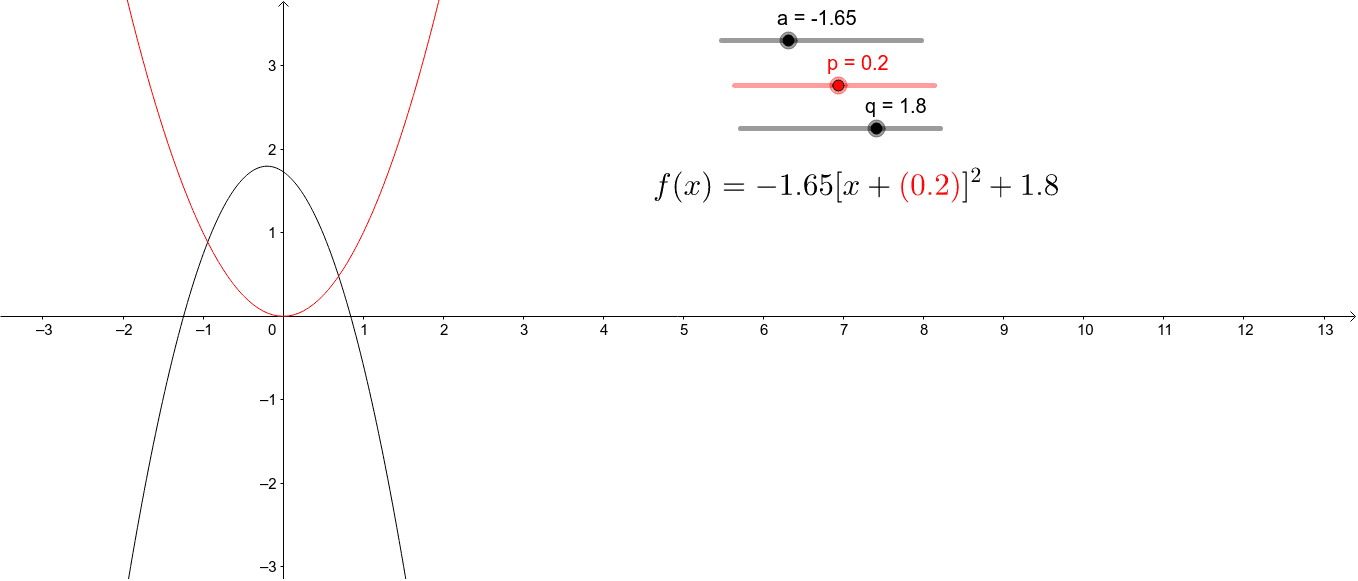
This GeoGebra example dynamically demonstrates the translation and scaling transformations of a parabola under the influence of parameters a, p, and q. The core mathematical concept is the standard form of a quadratic function y=a(x-p)^2+q, where p controls horizontal shift, q controls vertical shift, and a controls the direction and width of the opening. Construction highlights include using sliders or input boxes to define parameters a, p, q, with objects c and d possibly representing the original and transformed parabolas or auxiliary lines, and text1 displaying the current function expression or parameter values. It is suitable for middle or high school students learning properties of quadratic function graphs, transformation rules, and the intuitive effect of parameters on the graph. By dragging parameter sliders, students can observe changes in the vertex position and opening shape, deepening their understanding of function transformations.
GeoGebra Commands & Parameters
Numeric a(-1.65)Numeric p(0.2)Numeric q(1.8)y = (a * (x + p)^(2)) + qy = x^(2)