
Transform Sine Vertically, One Transformation at a Time
Loading the math board and drawing, please wait…
In collections
Sine and Cosine Functions
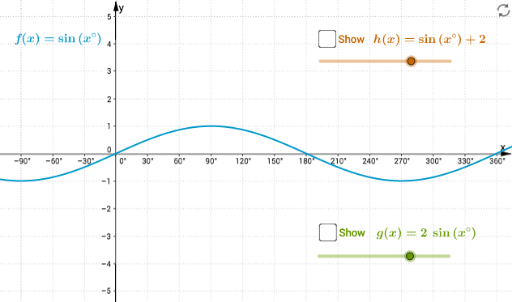
This example demonstrates how to transform the sine function vertically, one transformation at a time, visually showing the effect of each transformation. Core math concepts include the sine function, vertical transformations (addition/subtraction), and the impact of parameters. It uses GeoGebra commands/objects: f (function), a (slider for amplitude), g (transformed function), d (text), h (text), text1, text2, text3 (texts), b (variable), c (variable). Suitable for high school mathematics teaching to understand function graph transformation rules and deepen the understanding of parameter meaning.
GeoGebra Commands & Parameters
f(x) = sin(x°)Numeric a(2)g(x) = (a * sin(x°))Numeric d(2)h(x) = sin(x°) + dBoolean b(false)Boolean c(false)
AI Drawing Prompt Reference
Draw a sine function graph with the horizontal axis representing degrees and the vertical axis representing function values. First, plot the basic sine curve. Then, using an adjustable amplitude parameter, generate a second curve whose y-coordinate equals the original sine value multiplied by this parameter, visually showing how amplitude changes affect wave height. Next, introduce a vertical shift parameter to create a third curve whose y-coordinate equals the original sine value plus this shift, demonstrating vertical translation. Label each curve with text indicating the type of transformation, and include two toggles to show or hide the amplitude-transformed and vertically-shifted curves separately, allowing focused observation of each transformation.
The prompt above was compiled from the original drawing commands and is for reference only.