
Tracing the Derivative of a Function
Loading the math board and drawing, please wait…
In collections
Derivatives
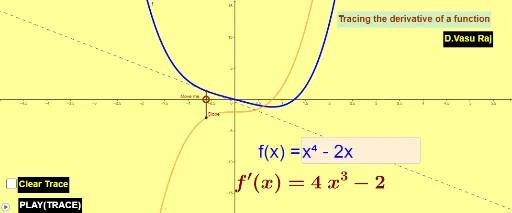
This example demonstrates how to trace the derivative of a function, visually representing the relationship between the function's graph and its derivative. Key math concepts include the geometric and physical meaning of derivatives, which represent the slope of the tangent line at a point on the function's graph. Construction highlights involve using GeoGebra commands and objects like Point, Tangent, Segment, Textfield, Derivative to draw the function f and its derivative f', along with tangents, points, and text annotations. Suitable for high school and above students to learn and understand the concept of derivatives in calculus, as well as for function graph analysis.
GeoGebra Commands & Parameters
Point(xAxis) → ATangent(B, f) → aSegment(B, A) → bTextfield(f) → inputBox1Point(Line[A, yAxis]) → DDerivative(f) → f'Segment(B, C) → hPoint(xAxis) → E
AI Drawing Prompt Reference
Draw a function and its derivative, showing the tangent line at a point on the function, the intersection of the tangent line with the x-axis, and the corresponding point on the derivative graph, connect the intersection point with the x-axis to the corresponding point on the derivative graph with a line segment, label the function expression and the derivative graph, clearly showing the relationship between the function and its derivative.
The prompt above was compiled from the original drawing commands and is for reference only.