
Mean-Median-Mode Interactive Demonstration
Loading the math board and drawing, please wait…
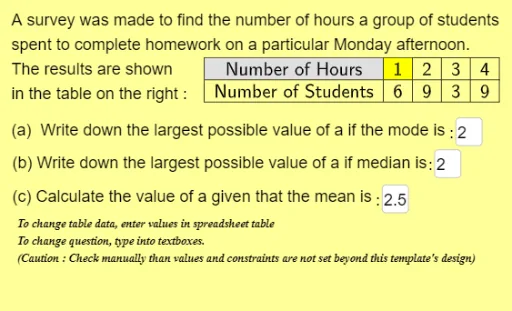
① This example demonstrates the positions and relationships of mean, median, and mode in a dataset through an interactive histogram and data table. ② Core mathematical concepts include measures of central tendency in descriptive statistics, frequency distribution, data sorting, and grouped statistics. ③ Construction highlights: using GeoGebra commands such as Median, mean, Sequence, Sum, Element, TableText, Vector, and Textfield, it builds objects for data input, frequency counting, sorted search, calculation of mean/median/mode, visual bar charts, and text displays, including ListFrequencyVariableSearch, MatrixAllSortedSearch, medianvaluesearch, modevaluesearch, etc., with dynamic adjustment via sliders or text fields. ④ Suitable for middle school statistics lessons and introductory college statistics courses, helping students understand how different central tendency measures respond to data distributions.
GeoGebra Commands & Parameters
Median(Take[ListCategory, 2, 5], Take[ListFrequencyVariableSearch, 2, 5]) → medianvaluesearchmean(Take[ListCategory, 2, 5], Take[ListFrequencyVariableSearch, 2, 5]) → meanvaluesearchSequence(If[i < 5, "+", ""], i, 1, 5) → ListAddSignSequence(Element[ListCategory, i] + "×" + (Element[ListFrequencyVariableSearch, i] + Element[ListAddSign, i]), i, 2, 5) → CategoryFrequencyProductListSum(CategoryFrequencyProductList) → TextSumCategoryFrequencySum(Take[ListFrequencyVariableSearch, 2]) → totalfrequencySequence(Element[MatrixAllSortedSearch, 1, i], i, 1, totalfrequency) → ListAllSortedSearchSequence(Element[MatrixAllSortedSearch, 1, i], i, 1, totalfrequency) → ListAllSortedNumElement(Mode[ListAllSortedSearch], 1) → modevaluesearchTableText({ListCategory, ListFrequencyVariableText}, "c|_") → Table1ProblemSequence(Polygon[(i - 1, 0), (i, 0), (i, Element[ListAllSortedSearch, i]), (i - 1, Element[ListAllSortedSearch, i])], i, 1, totalfrequency) → DataVisualBarSequence(Text[Element[ListAllSortedSearch, i], (i - 1, Element[(ListAllSortedSearch * 1.1), i])], i, 1, totalfrequency) → DataVisualTextMedian(Take[ListCategory, 2, 5], Take[ListFrequencyNum, 2, 5]) → medianvalue1TableText({ListCategory, ListFrequencyVariableSearch}, "c|_") → Table3HiddenSearchTableText({ListCategory, ListFrequencyNum}, "c|_") → Table2SolutionVector((((2 * medianposition) - 1) / 2, (Element[ListAllSortedSearch, medianposition] * 1.3) + 2), (((2 * medianposition) - 1) / 2, (Element[ListAllSortedSearch, medianposition] * 1.2))) → medianpositionpointerTextfield(targetmode) → inputBox1Textfield(targetmedian) → inputBox2Textfield(targetmean) → inputBox3