
Throwing Darts
Loading the math board and drawing, please wait…
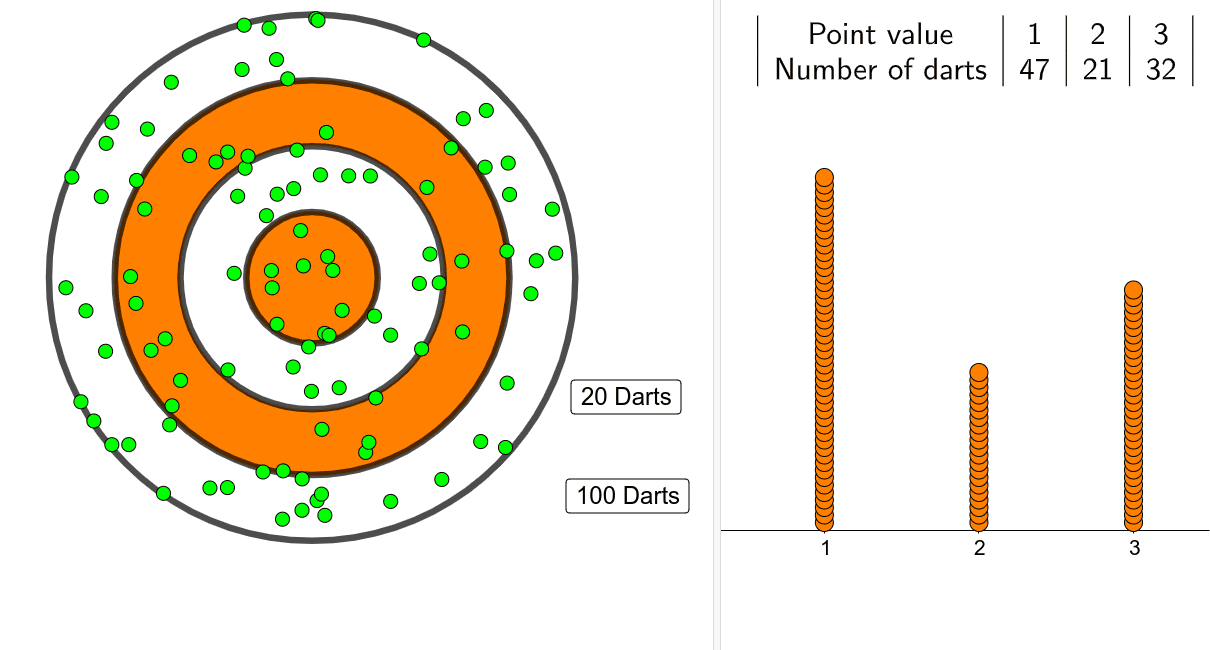
This example demonstrates the stochastic process of throwing darts within a circle and its probability distribution. Core math concepts include conditional probability, probability theory, stochastic processes, histograms, right triangles, functions, calculus, and circumcircle. Construction highlights involve using GeoGebra commands/objects like Circle, Sequence, TableText, and DotPlot. Suitable for high school and above students learning probability statistics, geometry, and calculus.
GeoGebra Commands & Parameters
Circle((0, 0), 1) → cCircle((0, 0), 2) → dCircle((0, 0), 3) → eCircle((0, 0), 4) → fSequence(Distance[Element[darts, a], (0, 0)], a, 1, Length[darts]) → l1Sequence(If[Element[l2, a] ≟ 1, 3, If[Element[l2, a] ≟ 2, 2, If[Element[l2, a] ≟ 3, 3, 1]]], a, 1, Length[l2]) → l3TableText({"Point value", 1, 2, 3}, {"Number of darts", CountIf[x ≟ 1, l3], CountIf[x ≟ 2, l3], CountIf[x ≟ 3, l3]}, "c|h") → text1DotPlot(l3, 0.15) → l4
AI Drawing Prompt Reference
Draw four concentric circles centered at the origin with radii of 1, 2, 3, and 4. Randomly throw darts into these circles and record the number of darts that land in each circle. Then, create a histogram to display the results and observe the probability distribution of darts landing in different circles.
The prompt above was compiled from the original drawing commands and is for reference only.