
THQ2.2: Translations of Trig Functions
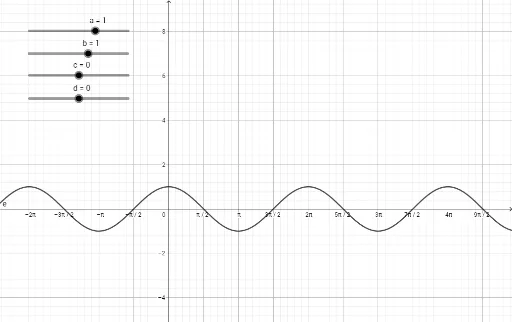
Loading the math board and drawing, please wait…
①This example demonstrates how trigonometric function graphs shift horizontally and vertically when parameters are changed, providing a visual and interactive exploration of translations. ②Core mathematical concepts include trigonometric functions, graph transformations (translations), the effect of parameters in function equations on the graph, and the relationship between the graph and coordinate axes. ③Construction details: Based on the summary, objects b, c, d, a, and e are used, likely representing translation parameters, trigonometric expressions, or key points on the graph. GeoGebra sliders or input fields control these parameters to update the graph in real time. ④This resource is suitable for high school students learning trigonometric graph transformations, as well as for teachers demonstrating the connection between algebraic parameters and geometric shifts in the classroom.
GeoGebra Commands & Parameters
Numeric b(1)Numeric c(0)Numeric d(0)Numeric a(1)e(x) = (a * cos((b * x) + c)) + d
AI Drawing Prompt Reference
Create a visual demonstration of translations of a trigonometric function graph. Draw a cosine curve whose horizontal stretch, horizontal shift, and vertical shift are controlled by three separate sliders, with an additional slider for amplitude. Initially, the curve is a standard cosine shape with amplitude 1, period 2π, and centered near the origin. Adjusting the horizontal shift slider moves the curve left or right along the x-axis; adjusting the vertical shift slider moves it up or down along the y-axis; adjusting the horizontal stretch slider compresses or stretches the curve horizontally; adjusting the amplitude slider changes the curve's height. Include coordinate axes and a grid to observe the shifts clearly.
The prompt above was compiled from the original drawing commands and is for reference only.