
Function Graph Transformations
Loading the math board and drawing, please wait…
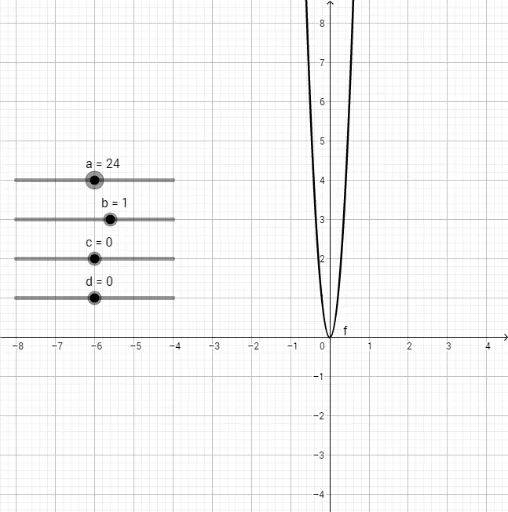
This example demonstrates the translation of function graphs in the coordinate system, involving core math concepts like function graphs, translation transformations, and vector operations. It uses GeoGebra commands/objects: objects: a, b, c, d, f. Suitable for high school students learning function graph transformations and understanding the relationship between translation and vectors, ideal for classroom demonstrations or homework practice.
GeoGebra Commands & Parameters
Numeric a(24)Numeric b(1)Numeric c(0)Numeric d(0)y = (a * ((b * x) + c)^(2)) + d
AI Drawing Prompt Reference
Draw a function graph in a coordinate system that demonstrates translation transformations by shifting the base function graph along the x-axis and y-axis, illustrating the relationship between translation and vectors. Start by plotting the base function, then adjust the translation distances using given numerical parameters, and finally compare the translated graph with the original to highlight the effect of translation transformations.
The prompt above was compiled from the original drawing commands and is for reference only.