
Thermometer
Loading the math board and drawing, please wait…
In collections
Introduction to Integers and Integer Arithmetics
Introduction to Integers and Integer Arithmetics
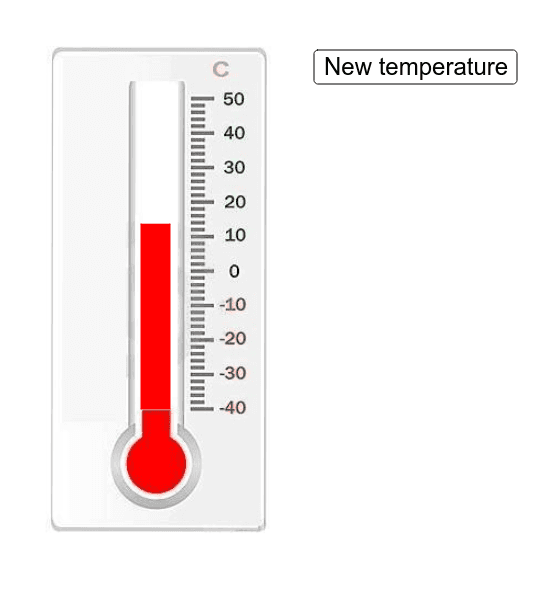
This is a simple thermometer that displays random temperatures. It demonstrates how to create a dynamic thermometer model using GeoGebra. Core mathematical concepts include geometric construction and slider animation. By using commands like Point, Segment, Polygon, etc., a thermometer can be constructed. Suitable for middle school and above students to learn the principle of a thermometer and the creation of dynamic graphics.
GeoGebra Commands & Parameters
Point(Circle[C, a]) → ESegment(C, E) → bPoint(Circle[D, a]) → FSegment(D, F) → cSegment(E, F) → dPolygon(C, D, F, E) → poly1, c_1, d_1, f, e
AI Drawing Prompt Reference
Draw a thermometer model: first create two circles of equal radius, positioned one above the other with their centers aligned vertically. From the center of the upper circle, draw a line segment to a point on its circumference; similarly, from the center of the lower circle, draw a line segment to a point on its circumference. Then connect these two points on the circumferences with a slanted line. Finally, use the four points (the two centers and the two circumference points) to form a quadrilateral, representing the main glass tube of the thermometer. The overall shape is a thermometer with a tilted tube, suitable for dynamic temperature display via a slider.
The prompt above was compiled from the original drawing commands and is for reference only.