
The Unit Circle and Trigonometric Visualization
Loading the math board and drawing, please wait…
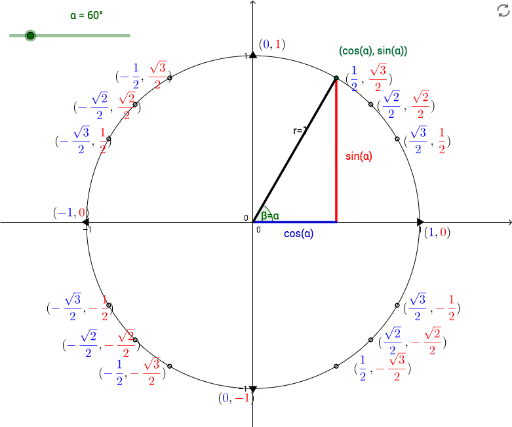
This GeoGebra example dynamically illustrates the relationship between points on the unit circle, angles, and trigonometric function values. It demonstrates the geometric definition of sine, cosine, and tangent using the unit circle, along with angle measurement in radians and degrees, and introduces the concept of limits as points approach key positions on the circle. The construction uses commands such as Point, Segment, and Angle to create the circle, radii, and angle markers, with multiple labeled points (A, B, C, D, etc.) and text objects (text1 to text14) updating values in real time. This resource is ideal for high school and early college students learning trigonometric periodicity, symmetry, and the foundational role of the unit circle in deriving identities. It also serves as an interactive tool for teachers to demonstrate core concepts in trigonometry and precalculus.
GeoGebra Commands & Parameters
Point(xAxis) → BSegment(C, A) → gAngle(D, K, C) → βSegment(B, A) → fSegment(B, C) → h
AI Drawing Prompt Reference
Draw a unit circle centered at the origin, with a point on the positive x-axis. From the center, draw a radius to a point on the circle that moves with a slider for the angle. Then draw a vertical segment from that point to the x-axis, and a horizontal segment from the foot to the center, forming a right triangle. Mark the angle at the center with an arc, and display its measure in both radians and degrees. Place several key points on the circle for special angles, color them differently, and show their sine, cosine, and tangent values. Add text labels that update in real time, and illustrate how these values change as the point approaches certain positions.
The prompt above was compiled from the original drawing commands and is for reference only.