
The Sound of a Sine Wave by Malin Christersson
Loading the math board and drawing, please wait…
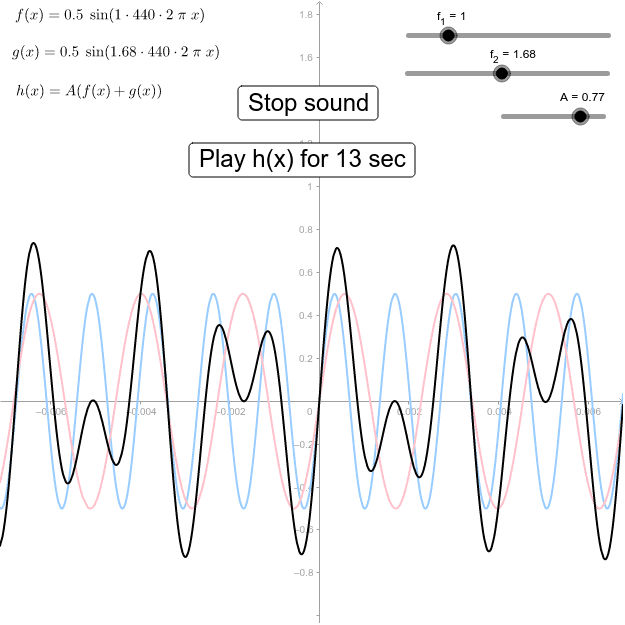
This example demonstrates the mathematical representation and sound wave of a sine function. Core math concepts include sine function, coordinate geometry, vectors, and statistics. It uses GeoGebra commands/objects like f_1, f_2, g, f, A, h, button1, button2, text1, text2, text3. Suitable for high school and above students to learn function graphs, sound waves, and mathematical modeling.
GeoGebra Commands & Parameters
Numeric f_1(1.0)Numeric f_2(1.68)g(x) = (0.5 * sin(((((f_2 * 440) * 2) * π) * x)))f(x) = (0.5 * sin(((((f_1 * 440) * 2) * π) * x)))Numeric A(0.77)h(x) = (A * (f(x) + g(x)))
AI Drawing Prompt Reference
Draw a sine wave function graph, including two sine waves with different frequencies, one with a frequency of 440Hz (f(x)) and another with 1.68 times the frequency of 440Hz (g(x)). Add these two waves to create a new waveform h(x) with an amplitude of 0.77. First, draw f(x) and g(x), then calculate and display h(x).
The prompt above was compiled from the original drawing commands and is for reference only.