
The Sine Function: Visualizing Trigonometry with Geometric Shapes
Loading the math board and drawing, please wait…
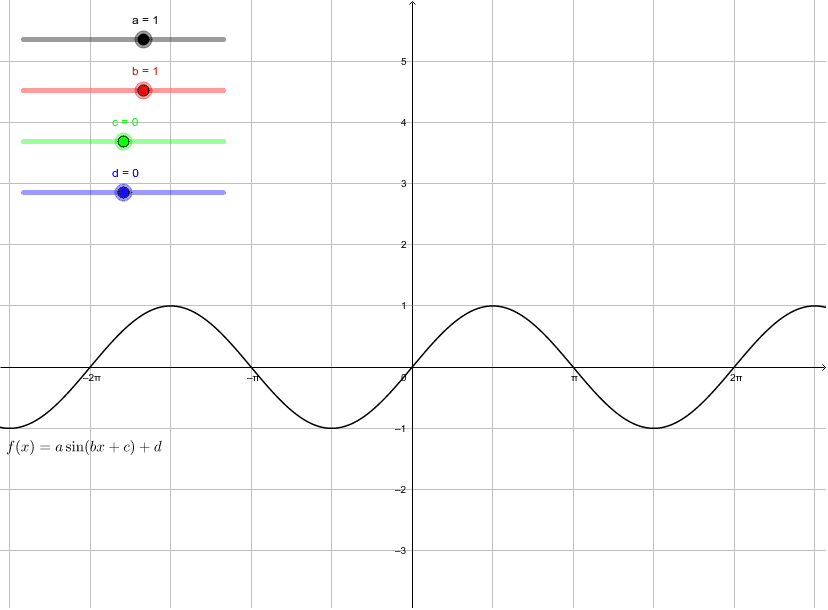
①This GeoGebra example dynamically illustrates the sine function graph while integrating geometric elements such as prisms, rhombi, and circumscribed circles, showing the interplay between trigonometric functions and both planar and solid geometry. ②Core mathematical concepts include the periodic nature, amplitude, and phase of the sine function, as well as the application of trigonometric ratios in geometric contexts like prisms, rhombi, and circumcircles. ③Construction highlights: Based on the summary, objects a, b, c, d, and f are used, likely involving sliders or parameters to control the sine curve, and GeoGebra commands to draw related geometric shapes (prism, rhombus, circumcircle), enabling dynamic linkage between the function graph and geometric objects. ④Suitable for high school or early college students to understand the graphical properties of the sine function and its practical use in geometric modeling, serving as a visual teaching aid in mathematics.
GeoGebra Commands & Parameters
Numeric a(1)Numeric b(1)Numeric c(0)Numeric d(0)f(x) = (a * sin((b * x) + c)) + d
AI Drawing Prompt Reference
Draw the sine function graph with sliders controlling amplitude, period, phase, and vertical shift. Construct the sine curve using these parameters and add a prism, a rhombus, and a circumcircle above the curve to demonstrate the periodic nature, amplitude, and phase of the sine function, and visually represent these concepts with geometric shapes.
The prompt above was compiled from the original drawing commands and is for reference only.