
Graphing Complex Numbers
Loading the math board and drawing, please wait…
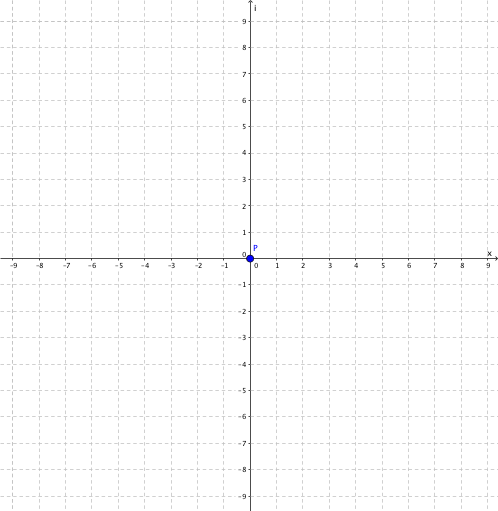
This example demonstrates the geometric representation of complex numbers and their rotational transformations. It involves core math concepts like complex numbers, rotation, centroid, standard deviation, binomial distribution, and coordinate geometry. Construction highlights include buttons (button1, button2), points (P), texts (text1, text2, text3), variables (a, w), and coordinates (A). Suitable for high school students and educators to understand complex number operations and geometric interpretations.
GeoGebra Commands & Parameters
Point P(0.0, 0.0)falseRandom[-9, 9] + (Random[-9, 9] * ί)Random[-9, 9] + (Random[-9, 9] * ί)
AI Drawing Prompt Reference
Draw a complex plane with a point at the origin. Generate two random complex numbers, each represented as a vector from the origin. One vector serves as the base, the other as the rotated result. Add a button that, when clicked, rotates the base vector around the origin by an angle controlled by a variable, updating the corresponding complex expression. Display three text labels: one for the origin's coordinates, one for the base complex number's real and imaginary parts, and one for the rotated complex number's parts. The figure illustrates the geometric meaning of complex multiplication, namely rotation and scaling.
The prompt above was compiled from the original drawing commands and is for reference only.