
The Relationship Between f and f'
Loading the math board and drawing, please wait…
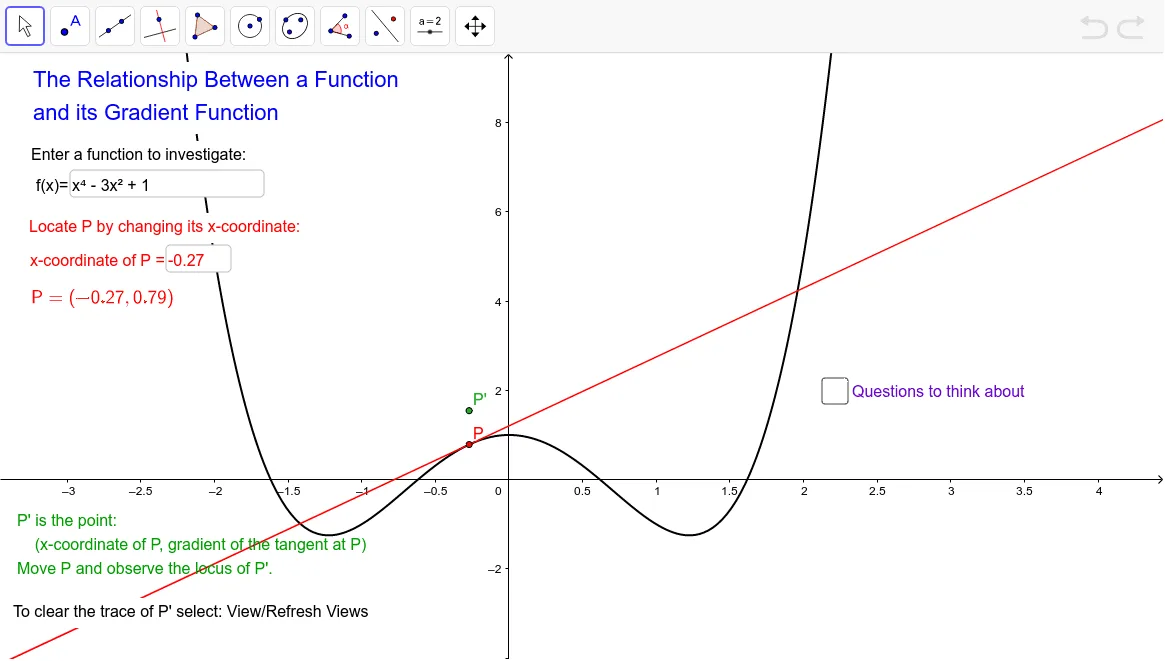
This example visually demonstrates the relationship between a function and its derivative, focusing on the nature of stationary points. Key math concepts include function graphs, derivatives, tangent lines, slopes, and special points. It utilizes GeoGebra commands like Textfield, Tangent, and Slope. Suitable for high school and above students to explore foundational calculus concepts or for educational purposes.
GeoGebra Commands & Parameters
Textfield(f) → inputBox1Tangent(P, f) → aSlope(a) → mTextfield(k) → InputBox1
AI Drawing Prompt Reference
Draw a function graph and mark a point on it. From this point, draw a tangent line and display its slope. Include two text boxes to input the function expression and the slope value, dynamically showing the relationship between the function and its derivative, especially near stationary points.
The prompt above was compiled from the original drawing commands and is for reference only.