
The Definite Integral: Visualizing Area and Summation
Loading the math board and drawing, please wait…
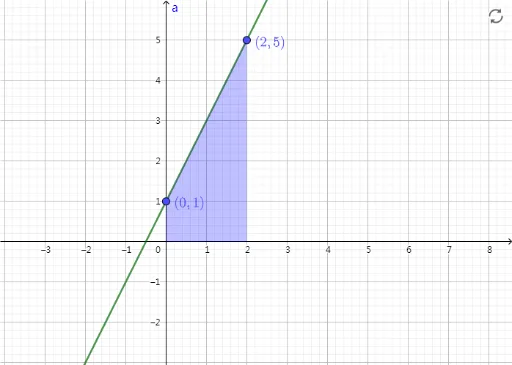
①This GeoGebra example demonstrates the geometric meaning of the definite integral, showing the area under a function curve and its connection to accumulation, using scatter plots and kite-shaped elements to enrich the visualization. ②Core mathematical concepts include the definite integral, area under a curve, Riemann sums, multiplication of interval length and function value, and combinatorial elements like the kite shape, possibly illustrating partition or summation patterns. ③Construction: Based on the summary, objects f (function), a (likely a parameter or lower limit), and A, B (possibly integration limits or area points) are used; GeoGebra commands create the function graph, scatter plot, and shaded area, likely with sliders to adjust the interval dynamically. ④Suitable for high school to early college calculus courses, helping students grasp the definition, geometric interpretation, and numerical approximation of integrals, and serving as an interactive tool for exploring integral properties or mathematical experiments.
GeoGebra Commands & Parameters
f(x) = (2 * x) + 1a(x, y) = 0 < x ≤ 2 ∧ 0 < y < (2 * x) + 1(0, 1)(2, 5)