
Temperature vs. Time Multiplication: Hyperbola, Orthocenter & Coordinates
Loading the math board and drawing, please wait…
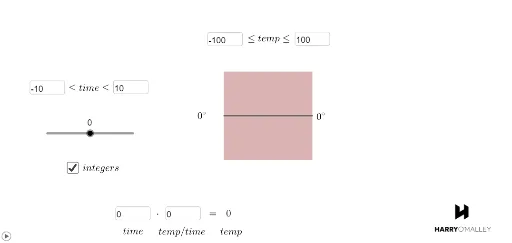
This GeoGebra example visualizes the multiplication relationship between temperature and time through dynamic simulation. Key mathematical concepts involved are hyperbola, orthocenter, coordinate geometry, Poisson distribution, and rotation. The construction utilizes commands such as Polygon, Segment, If, alongside InputBox and Textfield objects for interactivity. It is designed for high school or university mathematics education, aiding in the visualization of abstract functional relationships and geometric properties.
GeoGebra Commands & Parameters
Polygon(A, B, 4) → poly1, f, g, h, i, C, DTextfield(cmin) → InputBox1Textfield(cmax) → InputBox2Textfield(a) → InputBox3Textfield(outputmin) → InputBox4Textfield(outputmax) → InputBox5Textfield(p) → InputBox6Segment(E, F) → jTextfield(a) → InputBox3_1Textfield(outputmin) → InputBox4_1Textfield(outputmax) → InputBox5_1Segment(E_1, F_1) → j_1Polygon(A_1, B_1, 4) → poly1_1, f_1, g_1, h_1, i_1, C_1, D_1Textfield(a) → InputBox3_2Textfield(outputmin) → InputBox4_2Textfield(outputmax) → InputBox5_2Textfield(a) → InputBox3_3Textfield(outputmin) → InputBox4_3Textfield(outputmax) → InputBox5_3Textfield(a) → InputBox3_4Textfield(outputmin) → InputBox4_4Textfield(outputmax) → InputBox5_4Textfield(a) → InputBox3_5Textfield(outputmin) → InputBox4_5Textfield(outputmax) → InputBox5_5Textfield(a) → InputBox3_6Textfield(outputmin) → InputBox4_6Textfield(outputmax) → InputBox5_6Textfield(a) → InputBox3_7Textfield(outputmin) → InputBox4_7Textfield(outputmax) → InputBox5_7If(ZeroToOne < 94 / 256, 255, 94 / 256 ≤ ZeroToOne ≤ 210 / 256, ((-2.198 * (ZeroTo256 - 210))) / 256, ZeroToOne > 210 / 256, 0) → blueIf(ZeroToOne < 37 / 256, 0, 37 / 256 ≤ ZeroToOne ≤ 179 / 256, (48.845 * (ZeroTo256 - 37)^(1 / 3) / 256), ZeroToOne > 179 / 256, 1) → redIf(ZeroToOneTwo < 94 / 256, 255, 94 / 256 ≤ ZeroToOneTwo ≤ 210 / 256, ((-2.198 * (ZeroTo256Two - 210))) / 256, ZeroToOneTwo > 210 / 256, 0) → blue2If(ZeroToOneTwo < 37 / 256, 0, 37 / 256 ≤ ZeroToOneTwo ≤ 179 / 256, (48.845 * (ZeroTo256Two - 37)^(1 / 3) / 256), ZeroToOneTwo > 179 / 256, 1) → red2Textfield(rate) → InputBox7Segment(E_2, F_2) → kSegment(E_2, H) → l
AI Drawing Prompt Reference
Create a dynamic visualization showing the multiplication relationship between temperature and time, featuring a polygon and interactive input boxes to display functional relationships, with color changes to distinguish different regions, geometric structures built from polygons and segments, highlighting coordinate geometry and rotation transformations.
The prompt above was compiled from the original drawing commands and is for reference only.