
Tartini Tone: A Geometric Exploration of Music and Mathematics
Loading the math board and drawing, please wait…
In collections
Música y Matemáticas
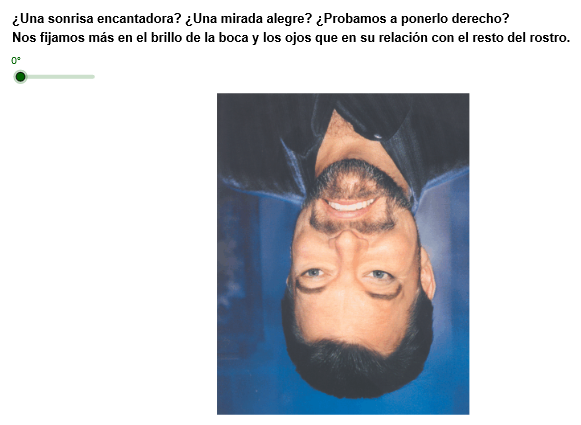
This GeoGebra example demonstrates the Tartini tone (combination tone) phenomenon by visualizing it through geometric transformations, turning an auditory effect into an observable graphical relationship. The core mathematical concepts involve geometric transformations (rotation), conic sections (ellipse and hyperbola), sequences, and logical reasoning, highlighting the deep connection between musical frequency ratios and geometric structures. Construction details: The Rotate command is applied to the image object imagen4, producing the rotated image imagen4', while the text object texto5 is used for labeling, creating a dynamic visual model. This resource is suitable for upper secondary to university-level interdisciplinary teaching of mathematics and music, enabling exploration of frequency ratios, difference tones, and geometric transformations in artistic contexts, and fostering student interest in the intersection of mathematics and music.
GeoGebra Commands & Parameters
Rotate(imagen4, α) → imagen4'
AI Drawing Prompt Reference
Visualize the Tartini tone phenomenon using geometric transformations, showing the dynamic effect of rotating an image and labeling key points to reveal the connection between musical frequency ratios and geometric structures. Start by drawing a base image, apply a rotation transformation, and then add text annotations to form a dynamic model illustrating the geometric relationship between ellipses and hyperbolas.
The prompt above was compiled from the original drawing commands and is for reference only.