
Tape Diagrams in Geometry
Loading the math board and drawing, please wait…
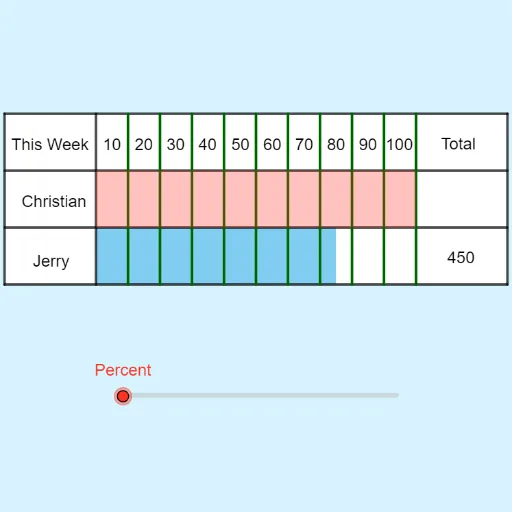
This example demonstrates how Tape Diagrams are used to visually represent the division and relationships of geometric shapes. Core math concepts include geometric partitioning, proportional relationships, and angle measurement. Construction highlights involve commands/objects like Point, Polygon, Segment, SelectedElement, Sequence, Intersect, Textfield from GeoGebra for creating and interacting with geometric elements. Suitable for middle school and above students learning geometric partitioning, proportion, and data analysis.
GeoGebra Commands & Parameters
Point(yAxis) → APoint(yAxis) → BPoint(yAxis) → EPoint(yAxis) → FPolygon(E, F, G, H) → q2, e, f, g, hSegment(B_1, H_1) → nSegment(E_1, I_1) → pSegment(G_1, F_1) → qSegment(D_1, C_1) → rSelectedElement(increment) → oSequence(((i * Distance[D_1, G_1] / (100 / increment(slide))) + x(D_1), 3), i, 1, 100 / increment(slide)) → topSequence(((i * Distance[D_1, G_1] / (100 / increment(slide))) + x(D_1), 0), i, 1, 100 / increment(slide)) → bottomSequence(Segment[top(i), bottom(i)], i, 1, 100 / increment(slide)) → l1Intersect(p, r) → J_1Intersect(p, q) → K_1Intersect(f, q) → L_1Intersect(f, r) → M_1Polygon(M_1, J_1, (21 / 4 + 2, y(K_1)), (21 / 4 + 2, y(L_1))) → q5, i_1, j_1, k_1, l_1Polygon(E, F, G, H) → q7, e_1, f_1, g_1, h_1Polygon(T, S, K_1, J_1) → q1, t, s, i, jTextfield(ans4) → InputBox1Textfield(text2) → InputBox3Textfield(text3) → InputBox2