
Tape Diagrams in Algebra (with examples) by artipal81 (5)
Loading the math board and drawing, please wait…
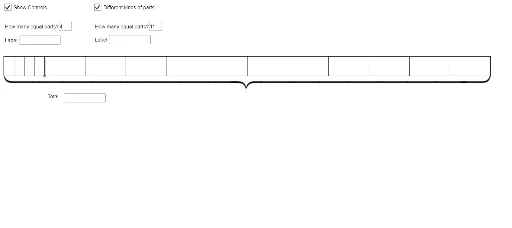
This example demonstrates how to use tape diagrams to visualize and solve algebraic problems, covering core concepts like algebraic operations, ratios, and geometric intuition. It constructs diagrams using GeoGebra commands like Textfield, Polygon, Point, Segment, Midpoint, and Sequence, making it suitable for middle school and above students to grasp complex quantitative relationships in algebra and geometry.
GeoGebra Commands & Parameters
Textfield(m) → InputBox1Textfield(text5) → InputBox2Textfield(n) → InputBox3Textfield(text6) → InputBox4Textfield(text7) → InputBox5Polygon(A, B, C, D) → poly1, a_1, b, c, dPoint(poly1) → ESegment(E, F) → fMidpoint(D, F) → GMidpoint(F, C) → HSequence(Segment[A + ((i_1 * (k - 1)), 0), A + ((i_1 * (k - 1)), h)], k, 1, m) → list1Sequence(Segment[E + ((i_2 * (p - 1)), 0), E + ((i_2 * (p - 1)), h)], p, 1, n) → list2Sequence(Segment[A + ((i_3 * (k - 1)), 0), A + ((i_3 * (k - 1)), h)], k, 1, m) → list3Sequence(Text[text6, (x(E) + (r * i_2) + i_2 / (n + 1), 0.7)], r, 0, n - 1) → list2tSequence(Text[text5, (x(A) + (q * i_3) + i_3 / (m + 1), 0.7)], q, 0, m - 1) → list3tSequence(Text[text5, (x(A) + (q * i_1) + i_1 / (m + 1), 0.7)], q, 0, m - 1) → list1t
AI Drawing Prompt Reference
Draw a tape diagram for algebra problems with two input boxes for variables m and n. Below, use a polygon to represent the whole, constructing multiple tape-like regions with points, line segments, and midpoints, labeled distinctly to show ratios and geometric intuition, forming a clear visual representation of algebraic concepts.
The prompt above was compiled from the original drawing commands and is for reference only.