
Tape Diagrams in Algebra Examples
Loading the math board and drawing, please wait…
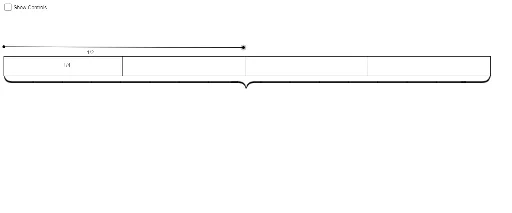
This example demonstrates how to use tape diagrams to represent and solve algebraic problems, involving core concepts like algebraic equations, proportional relationships, and geometric visualization. It utilizes GeoGebra commands and objects such as Textfield, Polygon, Point, Segment, Midpoint, and Sequence. Suitable for middle school and above students to learn visual methods for algebraic problem-solving.
GeoGebra Commands & Parameters
Textfield(m) → InputBox1Textfield(text5) → InputBox2Textfield(n) → InputBox3Textfield(text6) → InputBox4Polygon(A, B, C, D) → poly1, a_1, b, c, dPoint(poly1) → ESegment(E, F) → fMidpoint(D, F) → GMidpoint(F, C) → HSequence(Segment[A + ((i_1 * (k - 1)), 0), A + ((i_1 * (k - 1)), h)], k, 1, m) → list1Sequence(Segment[E + ((i_2 * (p - 1)), 0), E + ((i_2 * (p - 1)), h)], p, 1, n) → list2Sequence(Segment[A + ((i_3 * (k - 1)), 0), A + ((i_3 * (k - 1)), h)], k, 1, m) → list3Sequence(Text[text6, (x(E) + (r * i_2) + i_2 / (n + 1), 0.7)], r, 0, n - 1) → list2tSequence(Text[text5, (x(A) + (q * i_3) + i_3 / (m + 1), 0.7)], q, 0, m - 1) → list3tSequence(Text[text5, (x(A) + (q * i_1) + i_1 / (m + 1), 0.7)], q, 0, m - 1) → list1tSegment(I, L) → iSegment(M, N) → j