
Tangent Slope and Derivative Y-Value Correspondence
Loading the math board and drawing, please wait…
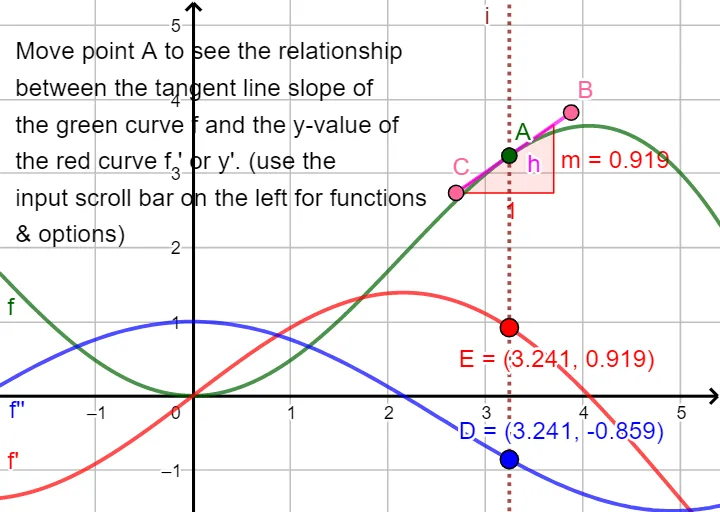
① This example dynamically demonstrates the correspondence between the slope of the tangent line to a function f and the y-value of its derivative f', while also showing the graph of the second derivative f'' to deepen understanding of the geometric meaning of derivatives as instantaneous rates of change. ② Core mathematical concepts include derivatives, tangent slopes, second derivatives, and relationships among function graphs, rooted in fundamental definitions and geometric interpretations in calculus. ③ Construction highlights: using GeoGebra commands Point, Tangent, Segment, OrthogonalLine, Intersect, and Slope to construct the tangent line and measure its slope; plotting the three curves f, f', and f''; moving point A along f dynamically updates the tangent line g and the slope value, with text objects text1 and text2 displaying the numerical correspondence. ④ Suitable for high school and early college students learning calculus, ideal for classroom demonstrations or self-exploration to build an intuitive link between derivative notation and graphical slope.
GeoGebra Commands & Parameters
Point(f) → ATangent(A, f) → gPoint(g) → BPoint(g) → CSegment(C, B) → hOrthogonalLine(A, xAxis) → iIntersect(f'', i, (3.2405144390802314, -0.8585785991163888)) → DIntersect(f', i, (3.2405144390802314, 0.9186703620613408)) → ETangent(E, f') → jPoint(j) → FPoint(j) → GSegment(G, F) → kSlope(h) → mSlope(k) → m_1
AI Drawing Prompt Reference
Draw the graph of function f and its first derivative f' and second derivative f''. Start by taking a point A on f and drawing the tangent line g at A. Then take points B and C on g. Draw a perpendicular line i from A to the x-axis, and find the intersection points D on f'' and E on f'. Draw the tangent line j at E on f', and finally draw a segment k between points F and G on j. Move point A dynamically to observe the changes in the slope m of line segment h and the slope m_1 of line segment k.
The prompt above was compiled from the original drawing commands and is for reference only.