
Tangent and Difference Quotient Demo
Loading the math board and drawing, please wait…
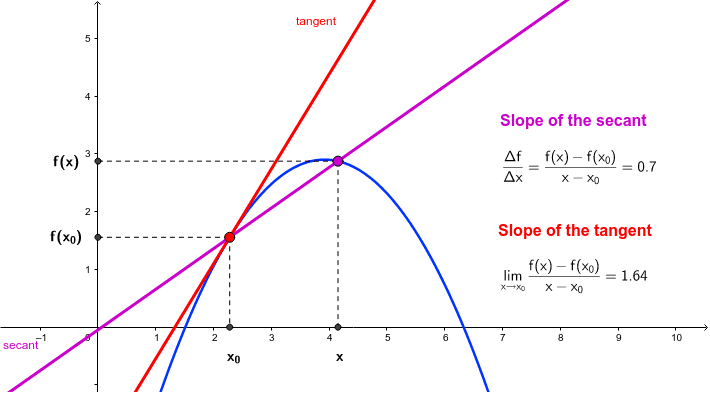
This example demonstrates the geometric connection between a tangent line and the difference quotient on a function's graph. Key math concepts include derivatives, tangent lines, difference quotients, and slopes. Constructed using GeoGebra commands like Point, Segment, Line, Slope, and Tangent. Suitable for high school calculus instruction or self-learning to understand the geometric meaning of derivatives.
GeoGebra Commands & Parameters
Point(f) → ASegment(C, A) → aSegment(A, B_1) → bPoint(f) → BSegment(F, B) → cSegment(B, E) → dLine(A, B) → secantSlope(secant) → eTangent(A, f) → tangentSlope(tangent) → g
AI Drawing Prompt Reference
Draw a function graph and mark two points on it, connecting them to form a line segment. Then, draw a tangent line from one of the points that touches the function graph. Label the slopes of both lines and show how the slope of the line segment approximates the slope of the tangent line to illustrate the geometric meaning of derivatives.
The prompt above was compiled from the original drawing commands and is for reference only.