
Tan Function
Loading the math board and drawing, please wait…
In collections
Trigonometry with the unit circle
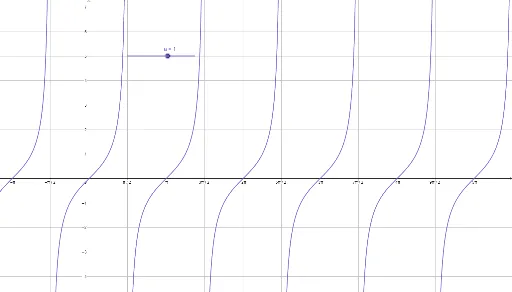
This example demonstrates the graph and properties of the tangent function, a type of trigonometric function. The graph shows periodic waveforms. By adjusting parameters, one can observe the periodicity, odd-even properties, and asymptotes of the tangent function. The example uses the function command in GeoGebra to draw the graph of the tangent function, suitable for high school mathematics education and learning.
GeoGebra Commands & Parameters
Numeric k(1)p(x) = (tan(x) * k)Numeric a(1)q(x) = tan((a * x))
AI Drawing Prompt Reference
Draw the graph of the tangent function to demonstrate its periodic waveforms, adjusting parameters to observe its periodicity, odd-even properties, and asymptotes. Start by plotting the basic tangent function, then adjust parameter k to see the effect of scaling on the graph, and adjust parameter a to observe changes in the period of the function, finally showcasing the typical features of the tangent function.
The prompt above was compiled from the original drawing commands and is for reference only.