
Tables, Equations, and Graphs in Sync: Geometry Construction with Annotations
Loading the math board and drawing, please wait…
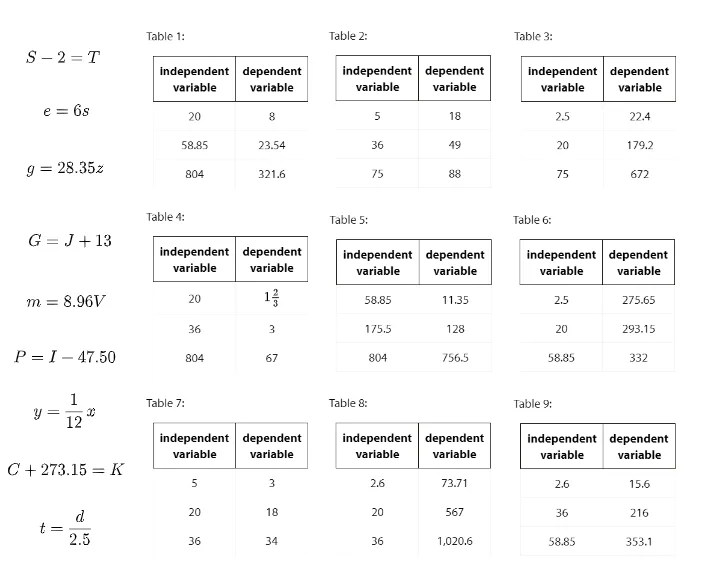
This example demonstrates how to link table data, algebraic equations, and geometric graphics together in GeoGebra so that multiple objects update coherently from construction steps to final visualization. It centers on concepts such as the incircle/inscribed circle relationships, vector ideas in a 3D setting (three-dimensional vectors), statistical characteristics as a thematic component, and polygon-based geometry (including a rhombus), together with arithmetic operations like subtraction within the construction logic. From the construction summary, the model builds many point objects (A, B, C, D, ... up to Q, R) and organizes multiple graphic groups (pic1 through pic9) to represent different stages or viewpoints. It also uses text objects (text1 through text9) to annotate how equations correspond to the displayed figures and results. Suitable for classroom demonstration in middle/high school and early university, especially for instruction on geometric construction, graphing with constraints, and using dynamic geometry to connect algebra and visualization.
GeoGebra Commands & Parameters
Point A(-11, 2)Point B(-4.67903817613391, 2)Point C(-4, 2)Point D(2.2751577526786537, 2)Point E(3, 2)Point F(9.320961823866085, 2)Point G(-11, -5)Point H(-4.6790381761339095, -5)Point I(-4, -5)Point J(2.2980597882723712, -5)Point K(3, -5)Point L(9.298059788272369, -5)Point M(-11, -12)Point N(-4.656136140540193, -12)Point O(-4, -12)Point P(2.275157752678654, -12)Point Q(3, -12)Point R(9.298059788272372, -12)
AI Drawing Prompt Reference
Draw a single coordinate-plane figure consisting of three horizontal rows of six points. Place the top row at y = 2 with x-values -11, -4.6790381761, -4, 2.2751577527, 3, 9.3209618239. Place the middle row at y = -5 with x-values -11, -4.6790381761, -4, 2.2980597883, 3, 9.2980597883. Place the bottom row at y = -12 with x-values -11, -4.6561361405, -4, 2.2751577527, 3, 9.2980597883. First plot points row by row in order, keeping the three rows perfectly horizontal and aligned for later geometry and equation linking.
The prompt above was compiled from the original drawing commands and is for reference only.