
Table of Points for a Linear Equation
Loading the math board and drawing, please wait…
In collections
Patterns & Equations
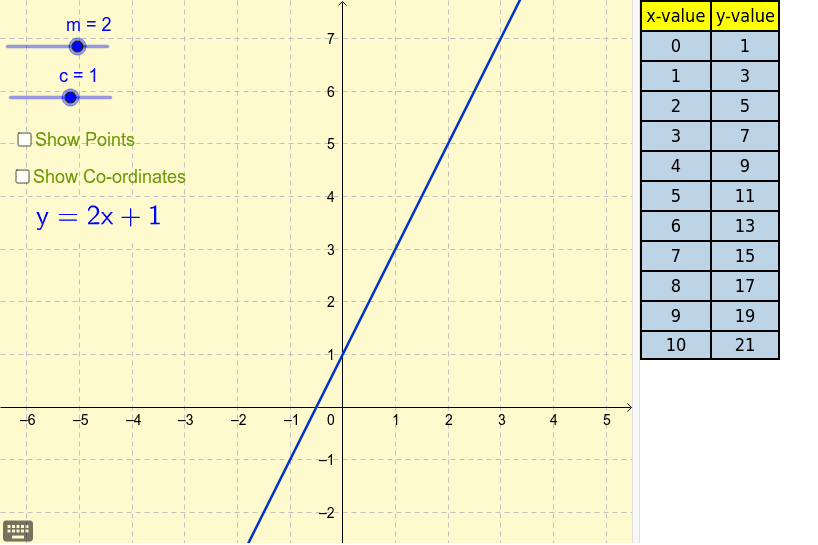
This example changes the linear equation using sliders and updates the table accordingly. It demonstrates the relationship between linear equations and point tables, involving concepts of functions and coordinate geometry. Commands used include Intersect and LaTeX. Suitable for middle school and above students to learn linear equations and function graphs.
GeoGebra Commands & Parameters
Intersect(a, yAxis) → CLaTeX(a) → text1
AI Drawing Prompt Reference
Create a graph of a linear equation's point table, where a slider changes the linear equation and updates the table accordingly. First, draw a line, then find its intersection with the y-axis, and finally display the LaTeX expression of the line equation.
The prompt above was compiled from the original drawing commands and is for reference only.