
Systems of Linear Inequalities Example 1: Feasible Region
Loading the math board and drawing, please wait…
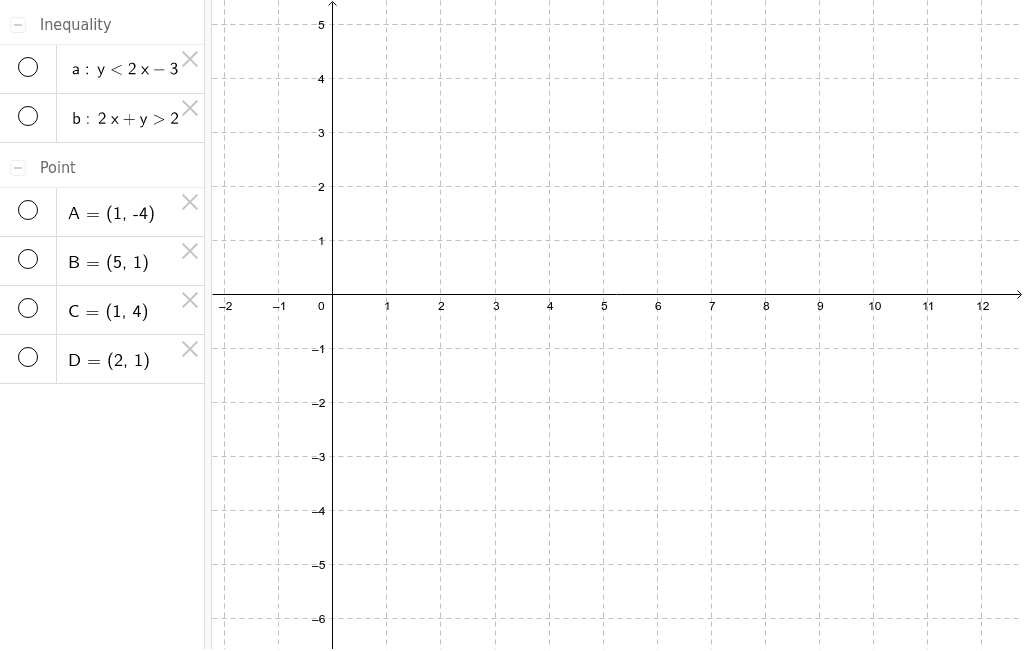
This example demonstrates how to construct and display the feasible region satisfying a system of linear inequalities in the Cartesian plane, visually showing the geometric meaning of the solution set. Core mathematical concepts include linear inequalities, intersection of inequality sets, boundary lines, and region partitioning. Construction highlights: based on the summary, objects a, b, A, B, C, D are used, where a and b likely represent two boundary lines (or lines corresponding to inequalities), and A, B, C, D are key points or vertices of the region. GeoGebra commands involve creating lines and points, then using inequality commands to shade the feasible area. Suitable for high school students studying coordinate geometry, introductory linear programming, or inequality applications, and for teachers to demonstrate how the solution set of a system of inequalities appears graphically.
GeoGebra Commands & Parameters
a(x, y) = y < (2 * x) - 3b(x, y) = (2 * x) + y > 2Point A(1, -4)Point B(5, 1)Point C(1, 4)Point D(2, 1)
AI Drawing Prompt Reference
Graph two lines in the Cartesian plane representing the inequalities y < 2x - 3 and 2x + y > 2, shade the region enclosed by these lines to indicate the feasible area, which includes the points (1, -4), (5, 1), (1, 4), and (2, 1) as its vertices, with the lines serving as the boundaries of the feasible region.
The prompt above was compiled from the original drawing commands and is for reference only.