
Systems of Linear Inequalities by catherine lykins
Loading the math board and drawing, please wait…
In collections
Linear Inequalities
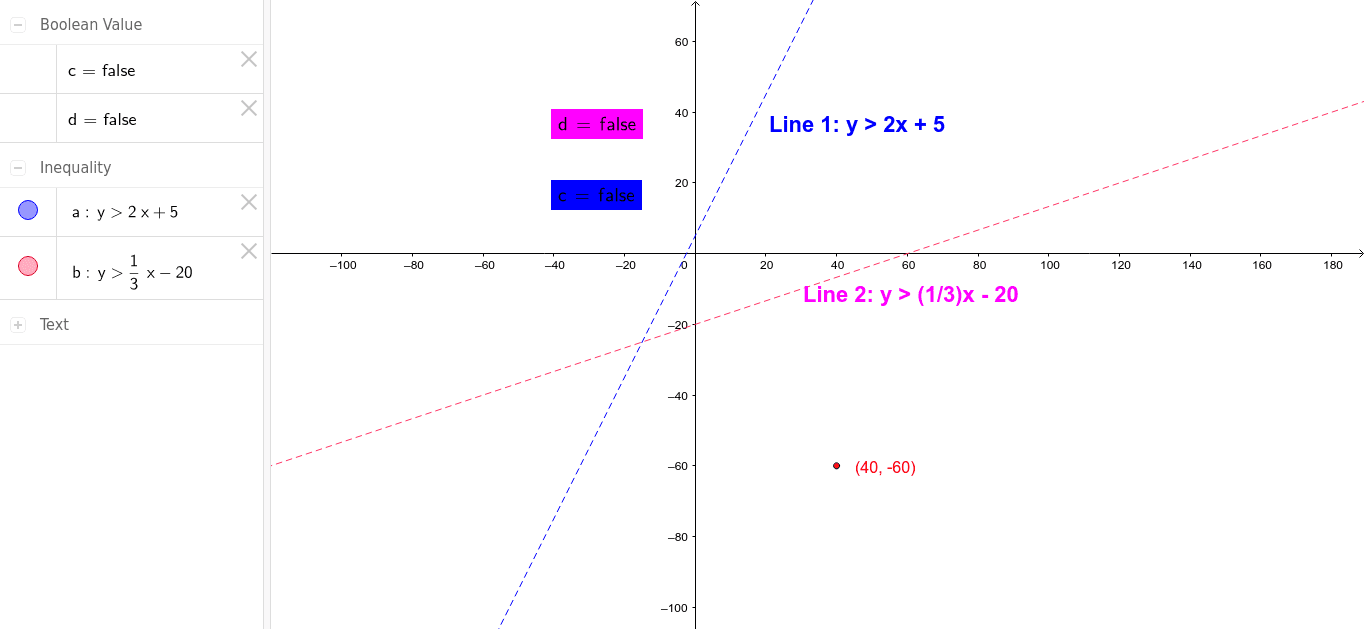
This example demonstrates the graphical representation of systems of linear inequalities. It involves the solution sets of linear inequalities and their regions in the coordinate system. Using GeoGebra commands, the graphical construction of linear inequalities and the observation of their intersection regions can be achieved. This example is suitable for high school mathematics education, particularly for coordinate geometry and inequality studies.
GeoGebra Commands & Parameters
LaTeX(c, true, true) → text3LaTeX(d, true, true) → text4
AI Drawing Prompt Reference
Draw the solution sets of linear inequalities in a coordinate system, showing the regions of different inequalities and labeling key parameters, to understand the intersection of these regions as the solution to the system of linear inequalities.
The prompt above was compiled from the original drawing commands and is for reference only.