
System of Linear Inequalities
Loading the math board and drawing, please wait…
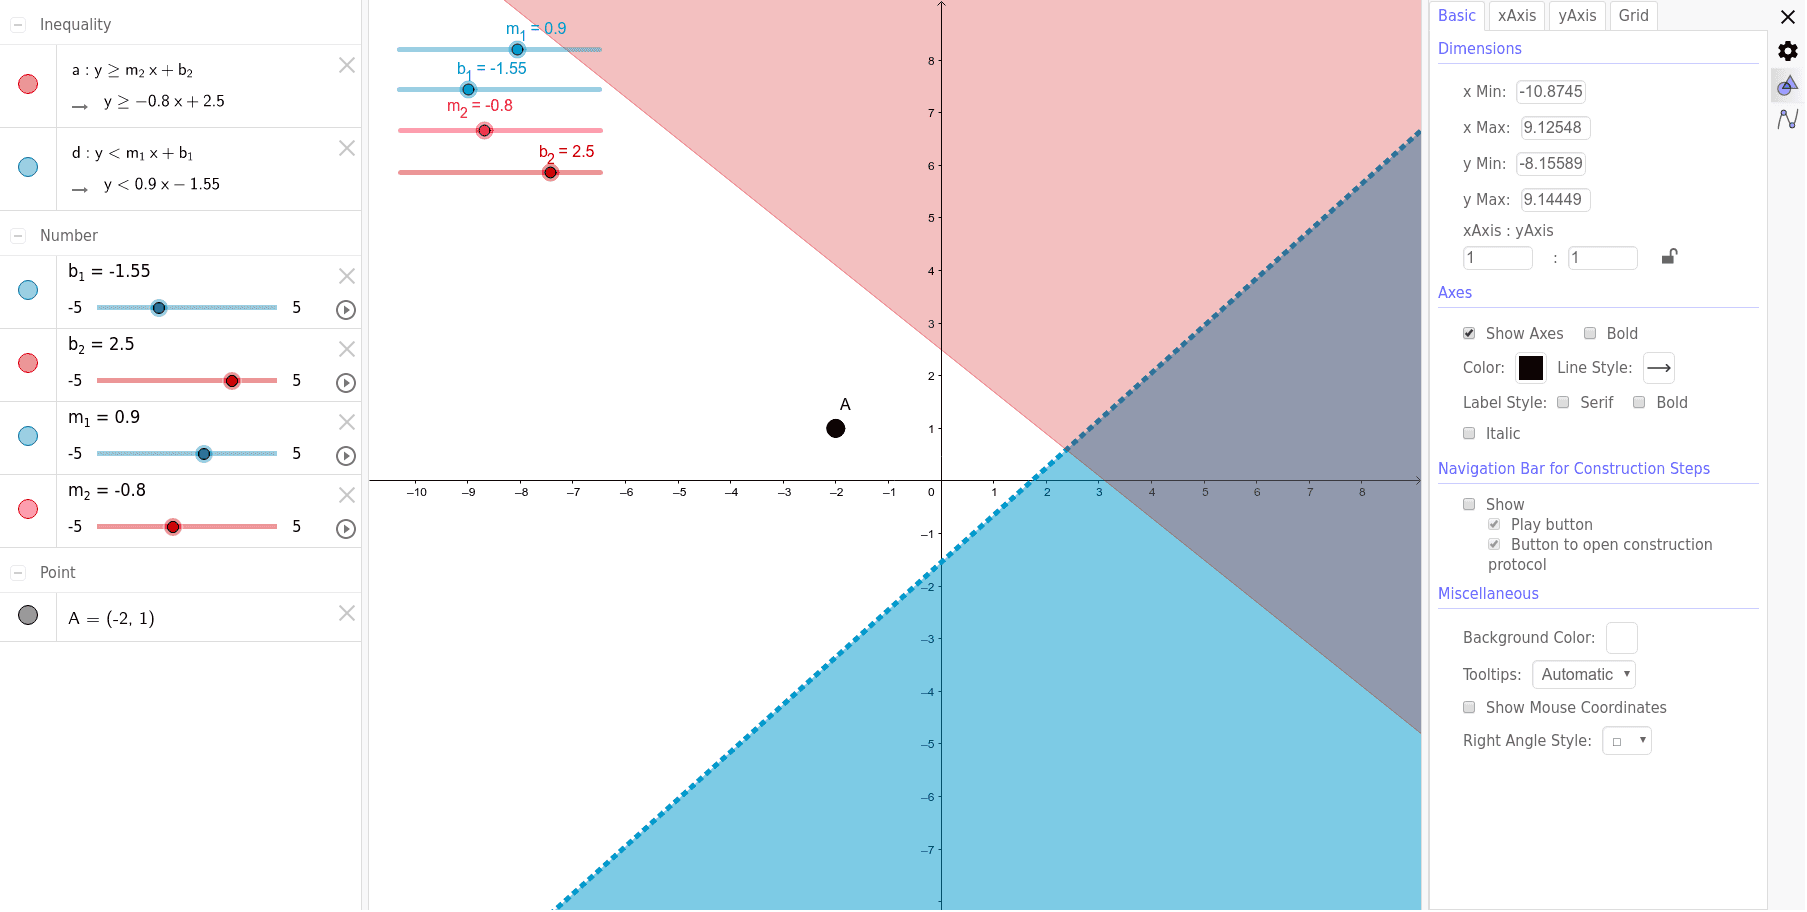
This example demonstrates how to graph a system of linear inequalities in a coordinate plane and observe the shaded region representing the solution set. Key math concepts include linear inequalities, boundary lines, solution set representation, and region determination. Construction highlights the use of GeoGebra objects b_1, m_1, d, m_2, b_2, a, A to define and manipulate inequality lines, with sliders for dynamic adjustments. Suitable for high school students learning the basics of linear programming and coordinate geometry graphing.
GeoGebra Commands & Parameters
Numeric b_1(-1.55)Numeric m_1(0.9)d(x, y) = y < (m_1 * x) + b_1Numeric m_2(-0.8)Numeric b_2(2.5)a(x, y) = y ≥ (m_2 * x) + b_2Point A(-2, 1)
AI Drawing Prompt Reference
Draw a coordinate plane with two lines. The first line has a slope of 0.9 and y-intercept of -1.55, represented as y < 0.9x - 1.55, with the solution set shaded. The second line has a slope of -0.8 and y-intercept of 2.5, represented as y ≥ -0.8x + 2.5, with the solution set shaded. Place a point A at (-2, 1) on the coordinate plane.
The prompt above was compiled from the original drawing commands and is for reference only.