
Swern's Rectangle Estimate Comparison
Loading the math board and drawing, please wait…
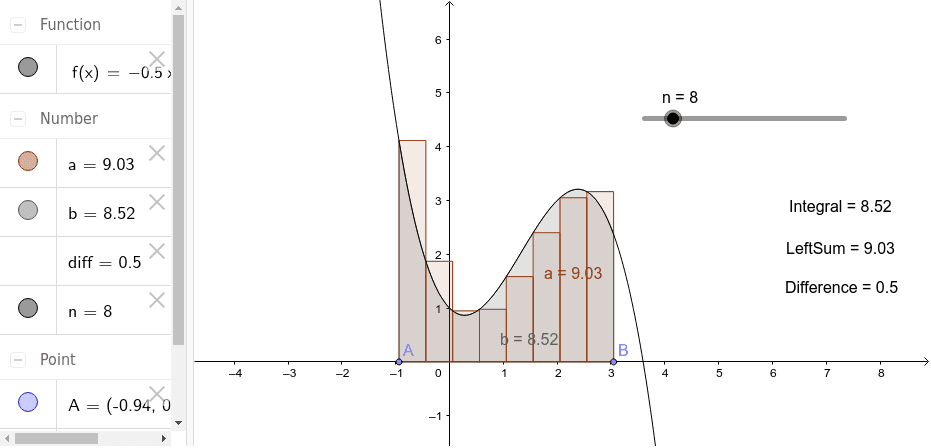
This example demonstrates how adjusting the number of rectangles in a Riemann Sum affects the estimate compared to the actual value of the area under the curve. Key concepts include integration and rectangle estimation. Commands used include Point, LeftSum, and Integral. Suitable for high school math education and learning.
GeoGebra Commands & Parameters
Point(xAxis) → APoint(xAxis) → BLeftSum(f, x(A), x(B), n) → aIntegral(f, x(A), x(B)) → b
AI Drawing Prompt Reference
Draw a function curve and approximate the area under it between two points on the x-axis using a series of left-endpoint rectangles. Place two points on the x-axis to define the interval, divide it into equal subintervals, and for each subinterval draw a rectangle whose height equals the function value at its left endpoint. Also show the exact area under the curve over the same interval as a shaded region or smooth filled area, so the total rectangle area can be visually compared with the exact area. Adjusting the number of rectangles changes the approximation accuracy.
The prompt above was compiled from the original drawing commands and is for reference only.